
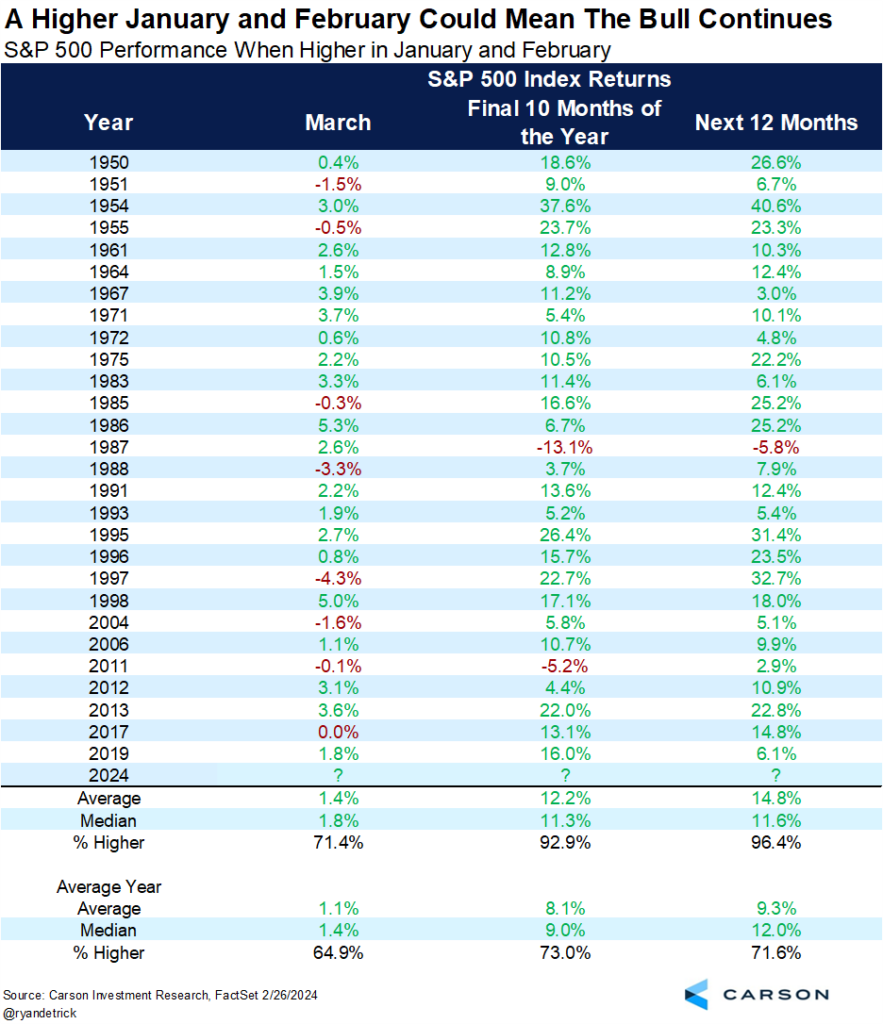
The market has started 2024 off continuing the trend that ended 2023. Historically, having a positive January and February portends having a positive calendar year. That is illustrated in the graphic below showing S&P 500 returns over the final 10 months of the year and over the next 12 months after it was up in both January and February. We are also seeing a good start to the year from small caps as they attempt to break out. Continuing to watch their performance will be important. A return of volatility will occur at some point, though, and it can be violent if the sense of complacency and greed in the market continues to rise. I’ll look at some things diverging from price and problem areas for the market that remains.
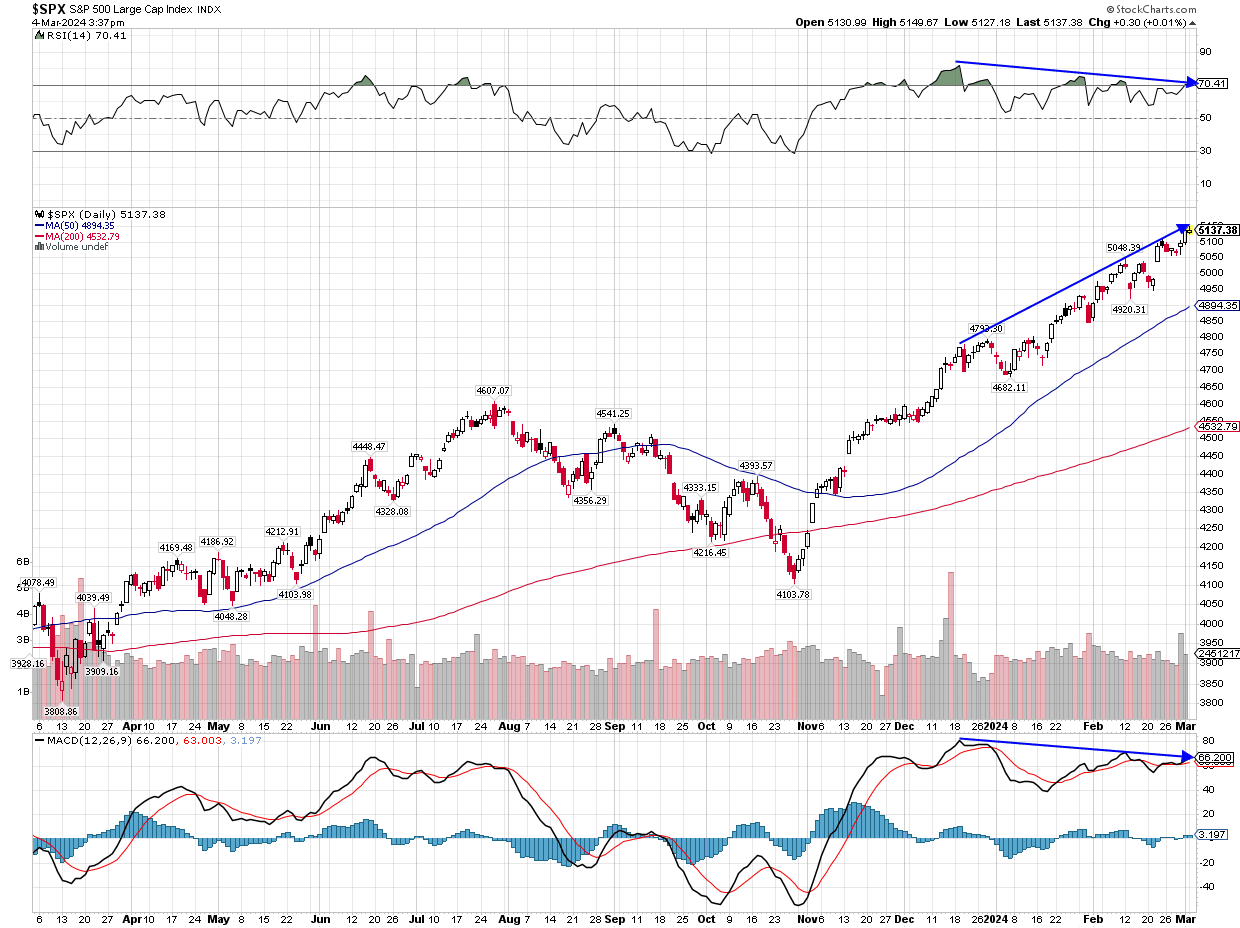
In taking a look at the S&P 500 over the last year, divergences have been appearing in the short term since the end of last year. There are 2 different momentum indicators on the chart below, the RSI (above) and MACD (below). As the arrows show, as price has continued to grind and trend higher, the indicators have been trending lower and peaking at a lower point. While divergences can serve as a warning sign, they’re not necessarily a sell signal until support levels begin to break. Price can consolidate for a period while indicators reset without anything breaking and would be a positive for the market. So far this year, the market has just continued to trend higher without any consolidation or pause. And it’s certainly possible it will continue to do that for a longer period of time.
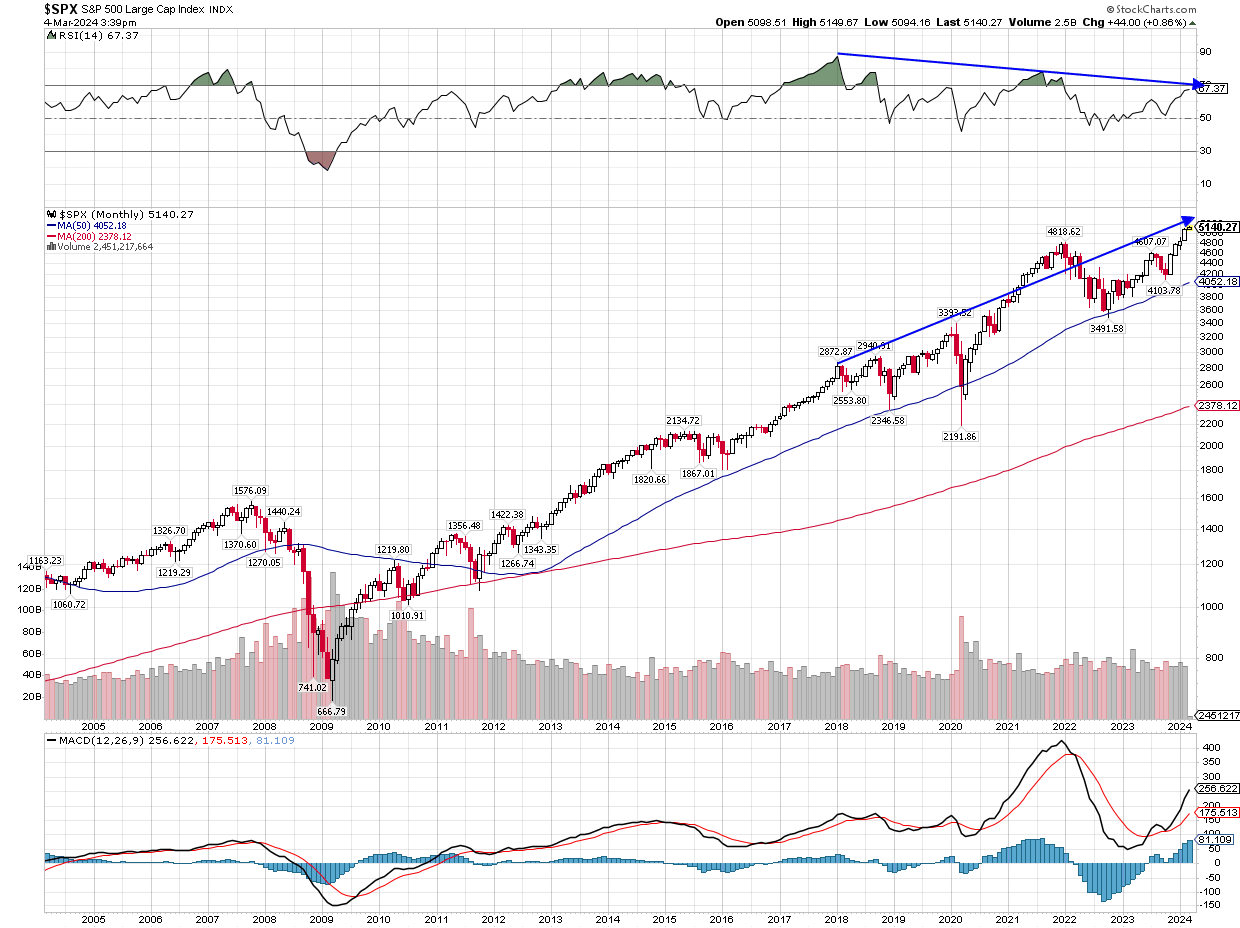
While short term divergences are appearing, longer term divergences have been with the market for an extended amount of time now. As shown below on a long-term monthly chart, the RSI on the S&P 500 peaked at the end of 2017. The RSI basically is a measure of speed and change of price movements, a measure of momentum for the market. The market has continued higher over the long term since then, but each peak in the market before a drop has seen the RSI peak at a lower point. Again, the divergence doesn’t mean the market is about to top and roll over, it does show that momentum has been waning for an extended period of time now. It illustrates to me how this has been a continuation of the bull market that started in 2009, and most likely not the early stages of a new long term bull market. I don’t see it as having a long runway like the market had in 2009 coming out of that bear market but would love for it to prove me wrong.
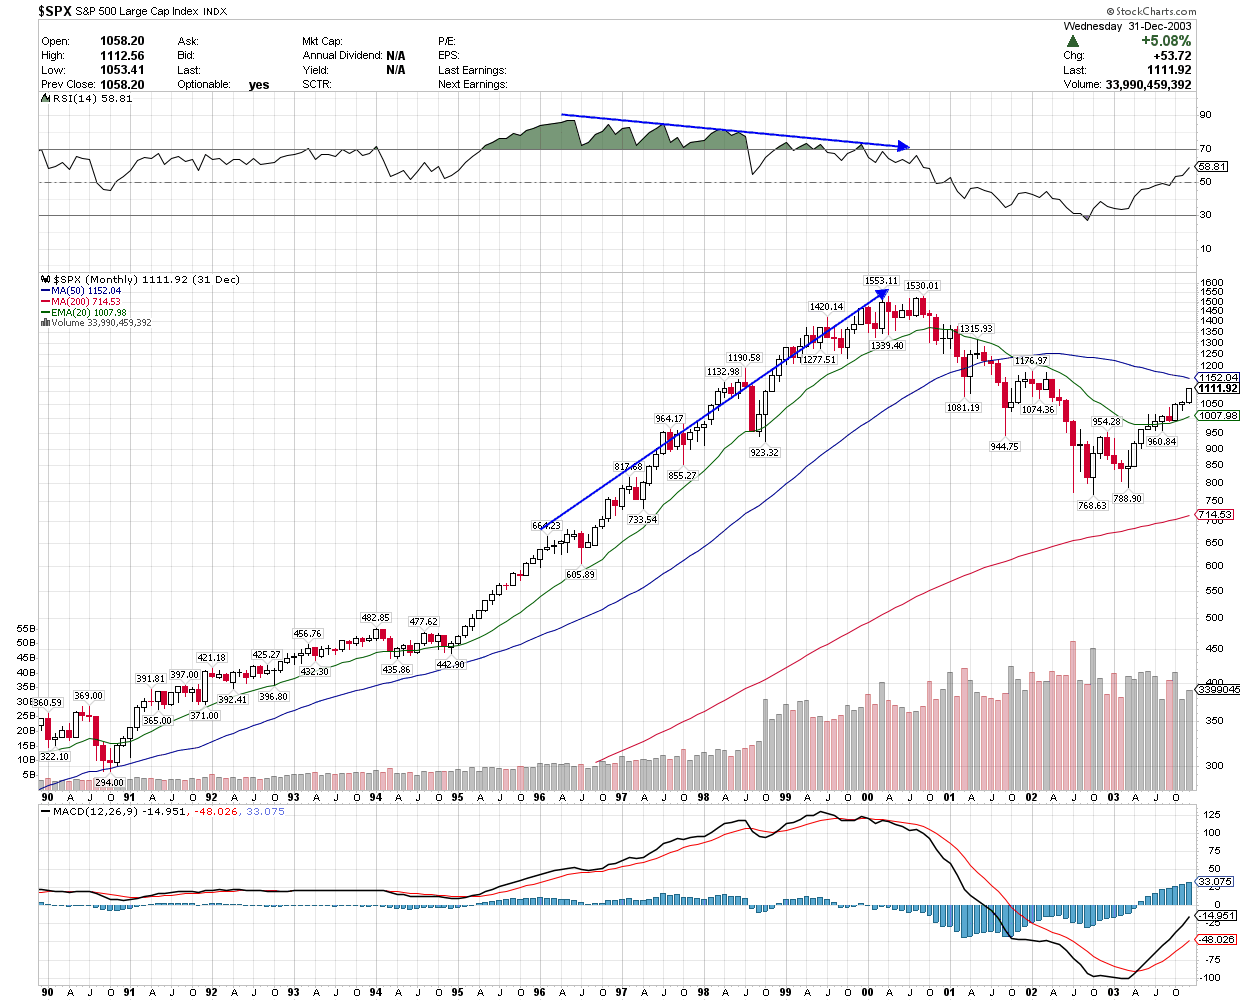
The chart below shows another long-term weekly chart but illustrating the market during the 1990’s and the end of that bull market. You can see the divergence on that chart as well between price and the RSI before price finally rolled over in March of 2000 at the height of the tech bubble. Many market commentators and analysts try to compare the period we are in now to that of the 1990’s. Some will argue we are nearing the peak of a bubble similar to 1999-2000. Some say this is just getting started and we are in the mid-90’s period with much further to go. Based on the diverging price and RSI, it would appear we are closer to the end than the beginning.
A potential problem area for the market and for the economy that I’ve highlighted before continues to be the banks. It was almost a year ago we saw multiple bank failures with the government and the Fed quickly stepping in to insure all deposits of those failed banks and attempt to bring confidence to the system. The bank that acquired the assets of failed Signature Bank was New York Community Bank (NYCB). A look at their chart shows investors’ concerns about more problems arising. As you can see their share price went from over $13/share last summer to now under $4/share.
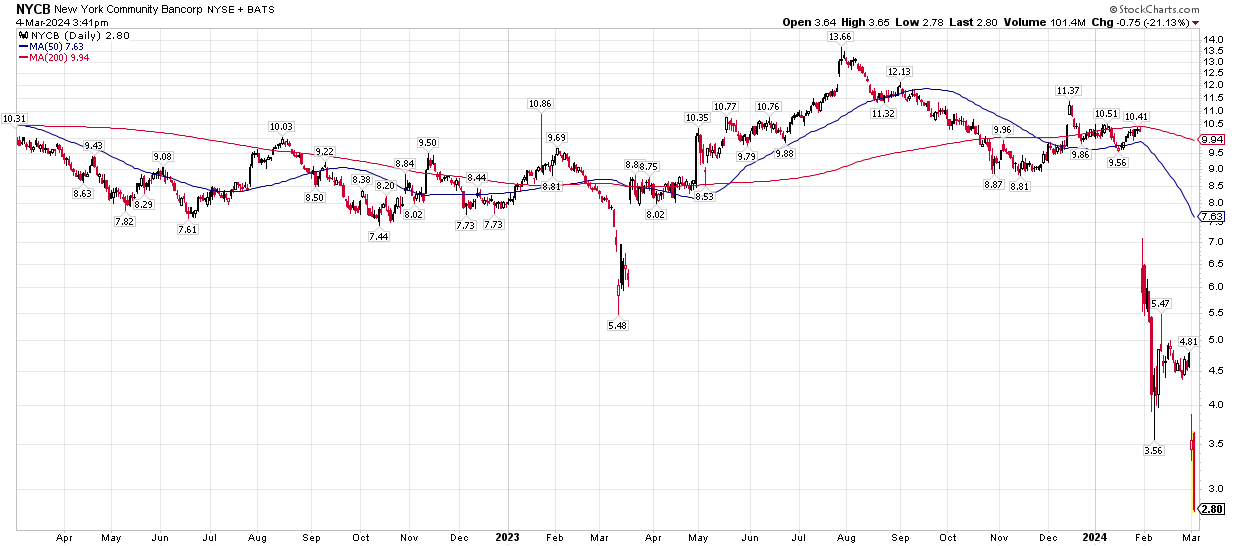
A recent report from NYCB detailed “material weaknesses” in internal controls related to their loan reviews causing its big drop over the last 2 trading days. The initial drop though came from their 4Q earnings report on January 31st where they reported a loss of $252 million. This was due to a sharp spike in loan loss provisions, which were $552 million. Due to this, NYCB also had to cut its dividend by 71%. What’s striking to me, though, is this large loss was reportedly due to only two loans. It wasn’t a series of multiple bad loans, just two that caused that big of a loss. Commercial real estate (CRE) loans, which combined with the spike in interest rates the last 2 years, have been the problem for most banks. With NYCB, CRE loans account for just 12% of its total lending. There are many banks with much higher CRE exposure that could face even worse issues and this shows it doesn’t take many bad loans to cause major problems. While most of the struggling banks are classified as “regional” banks, NYCB and those that failed last year are still top-40 banks.
In summary, with a great start to 2024, history tells us the market could continue to have more upside this year. While that may be the case, divergences are appearing and can lead to an unexpected decline at some point. It will be important to remain alert and not to become complacent. As always, please reach out with any questions or concerns.
Cory McPherson is a financial planner and advisor, and President and CEO for ProActive Capital Management, Inc. He is a graduate of Kansas State University with a Bachelor of Science in Business Finance. Cory received his Retirement Income Certified Professional (RICP®) designation from The American College of Financial Services in 2017.
DISCLOSURE
ProActive Capital Management, Inc. (PCM”) is registered with the Securities and Exchange Commission. Such registration does not imply a certain level of skill or training.
The information or position herein may change from time to time without notice, and PCM has no obligation to update this material. The information herein has been provided for illustrative and informational purposes only and is not intended to serve as investment advice or as a recommendation for the purchase or sale of any security. The information herein is not specific to any individual's personal circumstances.
PCM does not provide tax or legal advice. To the extent that any material herein concerns tax or legal matters, such information is not intended to be solely relied upon nor used for the purpose of making tax and/or legal decisions without first seeking independent advice from a tax and/or legal professional.
All investments involve risk, including loss of principal invested. Past performance does not guarantee future performance. This commentary is prepared only for clients whose accounts are managed by our tactical management team at PCM. No strategy can guarantee a profit.
All investment strategies involve risk, including the risk of principal loss.
This commentary is designed to enhance our lines of communication and to provide you with timely, interesting, and thought-provoking information. You are invited and encouraged to respond with any questions or concerns you may have about your investments or just to keep us informed if your goals and objectives change.