October 18, 2024

We are 3/4th of the way through 2024, and despite many things being thrown at it this year, the stock market has continued to trend higher. An old Wall Street saying that stocks climb a wall of worry definitely applies to 2024 so far. We’ve had a strange (putting it lightly) election season, higher interest rates for 2024 than expected, geopolitical tensions across the globe, and a weakening job market, just to name a few. Nothing has been able to knock it off its track, and some believe that nothing in the near future will. Even during this current 2-month period of September and October that is historically weak, stocks have continued to stretch higher.
As I’ve explained before, though, sentiment can be a funny thing with the stock market. Often when everybody is positive or everybody is negative on one side, the opposite of what everyone expects tends to happen. With the resiliency that the stock market has shown, there are signs of complacency and overexuberance. This isn’t any indication that the market is about to drop or any type of timing indicator. It can provide the fuel, though, for an eventual decline.
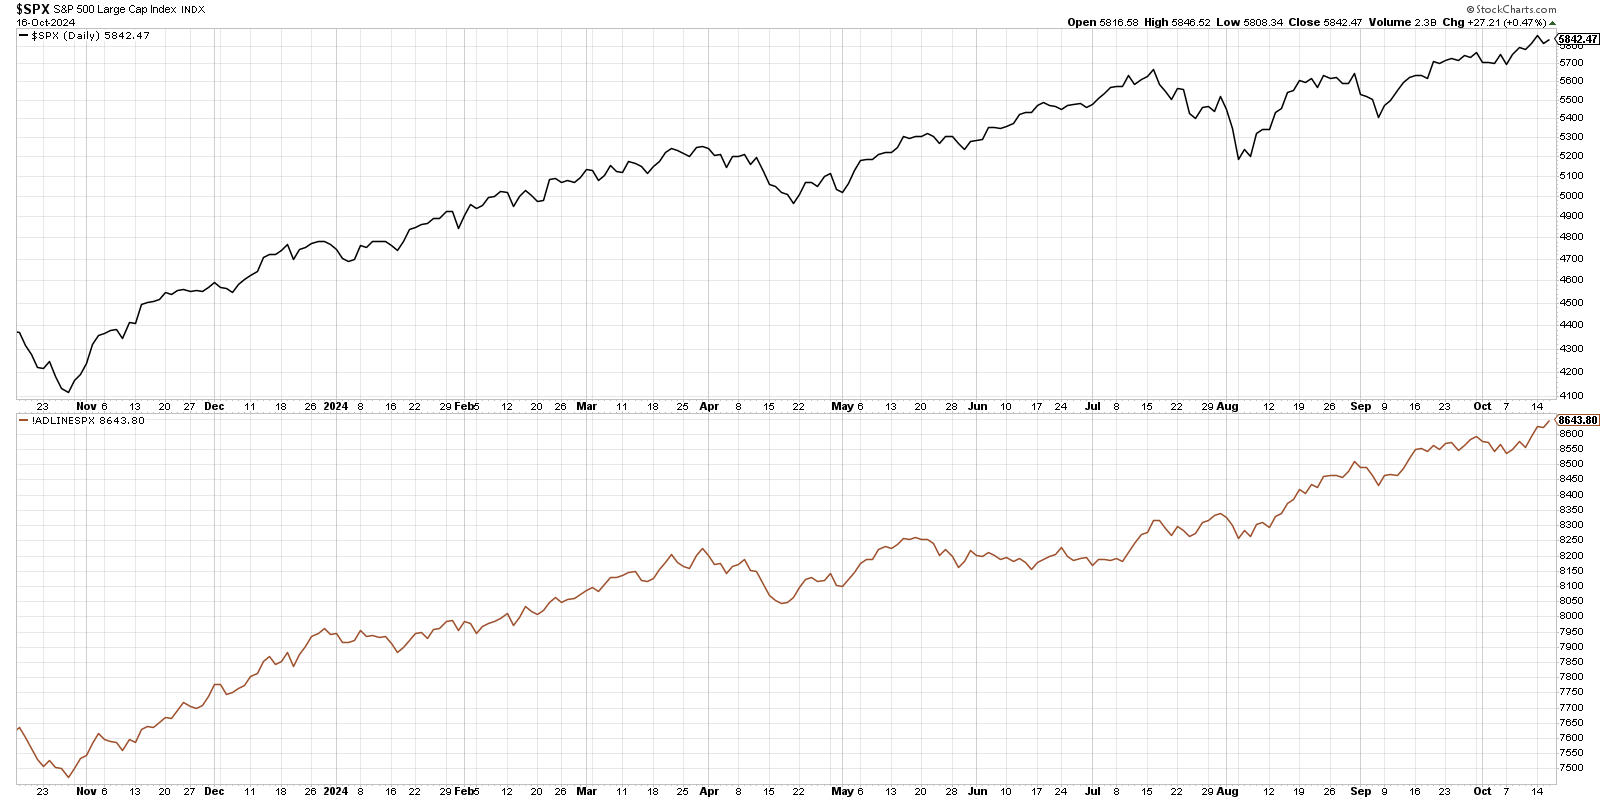
A positive development that has continued over the last year for the market is that the rally has been much broader based than what we’ve seen in some instances in the past. We’ve seen several periods where the mega cap tech stocks lead everything higher. Some of those stocks actually haven’t gotten back to their summer highs recently while many other areas of the market have carried the indexes higher. The number of stocks trading above their 50- and 200-day moving averages have been trending higher. The number of stocks recording all-time highs has been increasing. As seen below, the advance-decline line of the S&P 500 (bottom brown line) continues to trend higher with the price of the index (top black line). This measures the number of stocks in the index advancing minus the numbers of stocks declining. This is an encouraging sign of a healthy market as it confirms the upward trend of the S&P 500.

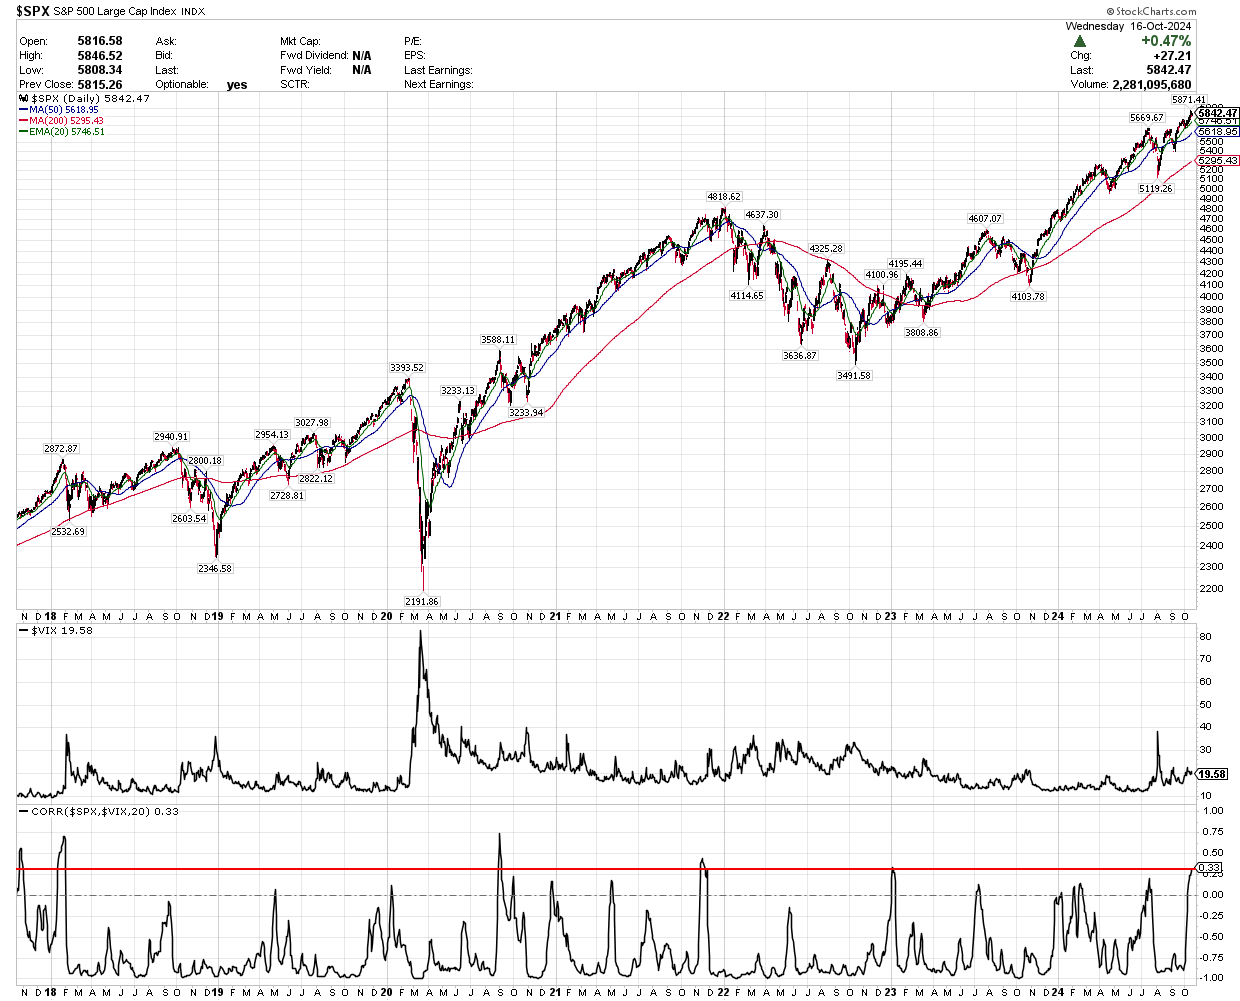
One area of concern that I’ve kept an eye on recently has been that of the VIX. This is the volatility index which measures options pricing on the S&P 500, based on one-month call and put options on the index. Typically, what I look for is how it relates to what the index itself is doing. The price of the S&P 500 and the VIX reading should be inversely correlated. A low or decreasing VIX comes with higher stock prices. A rising VIX typically comes with lower stock prices as investors grow concerned about the market. You want to see them moving in the opposite direction. The chart below shows the S&P 500 over the last 7 years and the different instances when the VIX is positively correlated and trending higher with the S&P. The top part of the chart is the S&P 500. The middle panel is the VIX reading. The bottom panel is the correlation measure between the two. When that measure is moving up, the 2 are positively correlated.

You can see there’s been different periods over the last 7 years where we’ve seen positive correlation. Crossing the zero line in that measure is when it’s time to start looking for possible trouble ahead. It doesn’t always lead to a decline in the market, as was seen early this year. You can see though we did have positive correlation going into the sharp drop at the beginning of August. Obviously, that decline was quickly recovered. The periods where we’ve seen correlation readings this high, though, have led to some type of drop in the market, including the eventual bear market of 2022. Ideally, we will see an easing of the VIX soon if the market continues to grind higher. The higher VIX reading could be due to the election as we march closer to that day, and how it reacts afterwards will be something to watch.
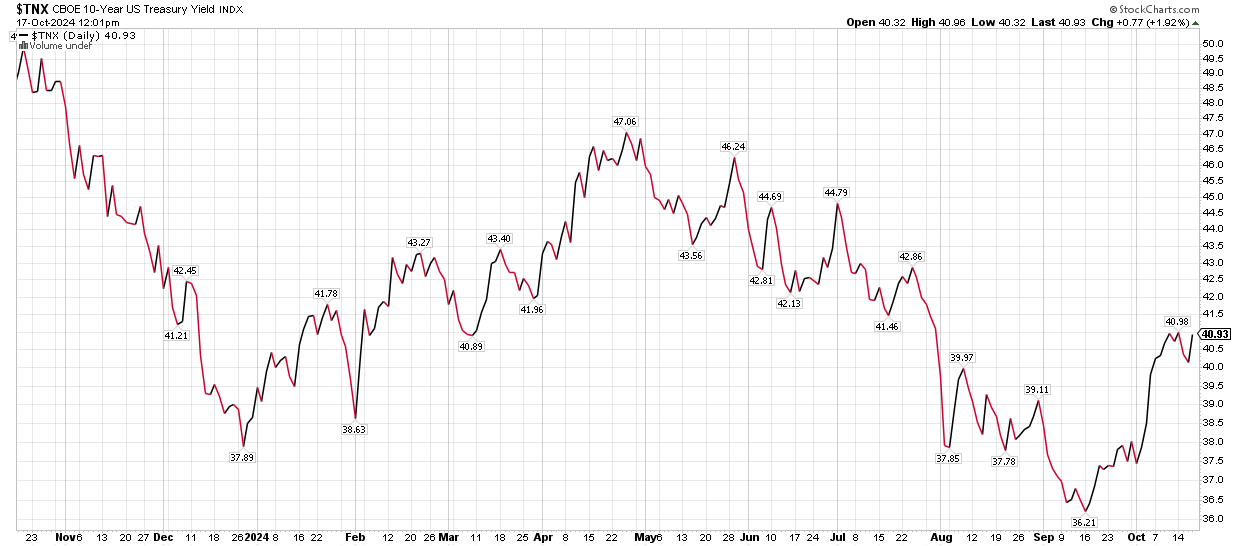
Another interesting area has been interest rates. As expected, the Federal Reserve cut their benchmark interest rate in September. The cut was expected, the size of the cut was the question, and they ended up cutting by 50 basis points (0.50%). Since the day the Fed cut, interest rates on the long end of the curve have actually gone up. This was a bit more unexpected. You can see below the jump in the 10-year U.S. Treasury yield since the Fed cut rates on September 18th. While the Federal Reserve can control short-term rates, they do not have much control over what long-term rates do.

You can see that the 10-year yield had been trending down since late April and bottomed at 3.62%. It now sits just shy of 4.1%, about a 13% increase. The 20-year Treasury yield has gone from 4% to 4.44%, and the 30-year Treasury yield has gone from 3.9% to 4.39%. Bond investors are either becoming more positive on the economy, expecting higher growth long-term, or they are concerned about inflation. If we see a repeat of the 1970’s and inflation reignites, that obviously puts a bind in the Fed’s plans to cut rates and reach their planned terminal rate of 3%.
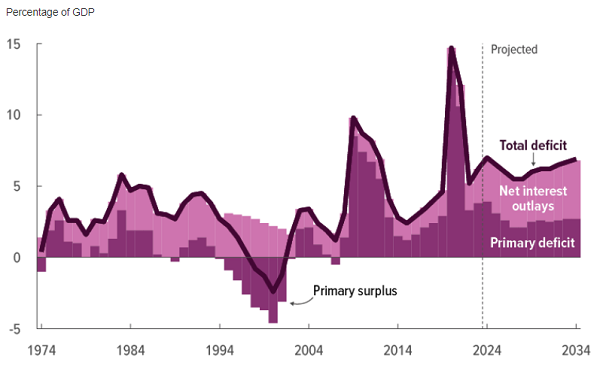
With higher interest rates, comes higher interest expense for our government. The higher interest payments have exacerbated an already large budget deficit and can give reason for the Federal Reserve to attempt to keep rates low. The government’s budget deficit was $1.8 trillion in fiscal year 2024 (ended September 30th) according to preliminary analysis by the Congressional Budget Office (CBO). This is the third largest deficit ever recorded in nominal terms, only behind the pandemic years of 2020 and 2021. The deficit was 6.4% of GDP, larger than any deficit in records going back to 1930, except the years around World War II, 2008 financial crisis, and the pandemic. With this occurring during what’s supposed to be a strong economy and a non-crisis period is startling. It is also occurring during a fiscal year where Federal tax collections grew 11% to $4.9 trillion, topping the previous all-time high in 2022. Tax collections reached 17.1% of GDP, which is higher than the prior 20-year average of 16.6% of GDP.
The net interest expense on public debt was $950 billion for the fiscal year. Interest on our country’s debt is now the second largest federal government expenditure after Social Security, which costs $1.5 trillion. The other large expenditures are Medicare ($869 billion), and defense spending ($826 billion). Even with forecasts that project interest rates to lower over the next few years while counting on inflation to subside, the CBO projects interest payments as a percent of GDP to continue to rise over time as the country’s debt continues to grow.

The stock market has enjoyed the large fiscal deficits of the last few years, and the deficits are projected to continue basically forever without meaningful changes. It’s impossible to predict when this will matter to markets. Large deficits and spending can create liquidity that finds its way into the stock market pushing prices higher. If politicians ever wanted to tackle the deficit, they could cut spending or increase taxes, things that would probably be unfavorable to the market. As we near an election, though, neither political party talks much about the deficit or the debt or has any desire to cut spending. So, it’s hard to see this era of fiscal dominance coming to an end any time soon. For now, the party continues…
Cory McPherson is a financial planner and advisor, and President and CEO for ProActive Capital Management, Inc. He is a graduate of Kansas State University with a Bachelor of Science in Business Finance. Cory received his Retirement Income Certified Professional (RICP®) designation from The American College of Financial Services in 2017.
DISCLOSURE
ProActive Capital Management, Inc. (PCM”) is registered with the Securities and Exchange Commission. Such registration does not imply a certain level of skill or training.
The information or position herein may change from time to time without notice, and PCM has no obligation to update this material. The information herein has been provided for illustrative and informational purposes only and is not intended to serve as investment advice or as a recommendation for the purchase or sale of any security. The information herein is not specific to any individual's personal circumstances.
PCM does not provide tax or legal advice. To the extent that any material herein concerns tax or legal matters, such information is not intended to be solely relied upon nor used for the purpose of making tax and/or legal decisions without first seeking independent advice from a tax and/or legal professional.
All investments involve risk, including loss of principal invested. Past performance does not guarantee future performance. This commentary is prepared only for clients whose accounts are managed by our tactical management team at PCM. No strategy can guarantee a profit.
All investment strategies involve risk, including the risk of principal loss.
This commentary is designed to enhance our lines of communication and to provide you with timely, interesting, and thought-provoking information. You are invited and encouraged to respond with any questions or concerns you may have about your investments or just to keep us informed if your goals and objectives change.


