
Halfway Through 2023
By Cory McPherson | July 2023
It’s hard to believe, but yes, we are already halfway through the year. We have seen quite the change in 6 months compared to where things were at the end of 2022. Many economists and market pundits were predicting recession to come this year throughout 2022. Sentiment for the stock market was extremely negative and expecting that the worst was still to come. In just 6 months, though, that has all changed. It’s hard to find anyone predicting a recession to occur in 2023 now. Sentiment for the market has completely flipped to extremely optimistic and the belief for most is the bear market that started in January 2022 is over.
What spurred this change? It’s hard to find anything specific, and certainly the A.I. (Artificial Intelligence) craze has played a part. But, I believe the thing that’s changed the most to flip sentiment and economic projections is price. Simply put, the price of the indexes like the S&P 500 and Nasdaq. Many believe the market will only go up from here, after many believed it was only going to continue down at the end of 2022. A flip from one extreme to another in a short amount of time doesn’t happen very often. Extremes in either direction can be dangerous.
One way to gauge market sentiment is using CNN’s Fear & Greed Index that they publish. You can see below how it is currently in the extreme greed zone. Readings of extreme greed have historically been seen around market tops. Or, at least, short-term tops that lead to corrections in the market. As the old saying goes, though, markets can stay irrational longer than you can stay solvent. Sentiment can remain stretched in either direction for an extended period of time. These sentiment tools aren’t necessarily timing indicators, but can give a good gauge of when to be more prepared, watching for the beginning of sentiment to change in the market.

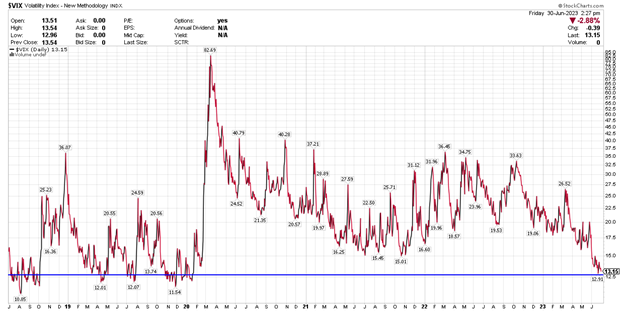
Another way fear in the market can be measured is using the volatility index (VIX). The VIX index calculation is designed to produce a measure of constant, 30-day expected volatility of the stock market. It’s derived from real-time prices of S&P 500 index call and put options. It is one of the most recognized measures of volatility in the market. When the VIX is climbing, that means higher volatility and more fear in the market. When it is falling, it means less volatility and a sense of calm in the market. Below you can see where the VIX is today, hovering around 13. We are at levels not seen since early 2020, right before the pandemic began and a high degree of volatility in the market. Like the fear and greed index, the VIX can stay low for an extended period of time. 2017 was marked by extremely low volatility, even getting near 10. It ultimately led to a volatility event in early 2018 that saw the market decline over 10% in a short amount of time, and an almost 20% decline in late 2018.
So, a low VIX reading can be both good and bad. It’s good that markets are more calm and experiencing less volatility. But that calm can ultimately lead to an unexpected volatility event sending stock prices lower and volatility higher. Again, this is not to be used as a timing indicator. But, if we saw the market begin to pull back with the VIX beginning to increase rapidly, then that would signal a shift in market sentiment.
A Look at the Market
Overall, in the stock market, what we like currently is that market breadth is showing signs of improvement. We outlined in our last newsletter how the mega cap technology stocks were pushing the indexes higher while everything underneath continued moving sideways or down. This has improved over the last few weeks, and we’d like to see it continue in the right direction. Looking at economically sensitive stocks specifically (energy, industrials, materials), many of those that have struggled for most of the year are showing some signs of strength.
The market did begin to move almost in a parabolic fashion in early June leading to a bit of a corrective pullback nearing its 20-day moving average. We are seeing it bounce again to end the 2nd quarter on a high note. The more it stretches to the upside, the more likely a deeper pullback will occur to get it back closer to its moving averages. How those pullbacks play out should give us an idea of how to adjust through the end of the year. Corrective pullbacks that find support along its moving averages can be used to add more exposure to the market. Impulsive declines could be signs of a more intermediate-term top that we would look to reduce exposure with.
Our long-term indicators that we follow continue to contradict each other instead of confirming each other. We’d like to see confirmation to have more confidence in this being the early stages of a new cyclical bull market. If this market continues to stretch to the upside with long-term signals still weak and negative divergences occurring with other indicators, then risk management will be even more prudent in what we do.

A Look at the Economy
As with stock market sentiment flipping, belief in the economy has also flipped. It’s much harder to find someone predicting recession in 2023 than it was just a few months ago. The hope last year for many was that the Federal Reserve would be able to orchestrate what they call a “soft landing”. Bringing inflation down while causing a shallow recession and no terrible damage to the economy. Now many are expecting a “no landing” scenario. The economy continues to grow without a recession, while inflation comes down. The belief would be the Fed could then cut rates because of lower inflation, and not because of economic trouble.
This is despite some economic numbers continuing to decline. What continues to hold is the labor market. While weekly initial jobless claims were increasing in June, it was still not enough to signal the beginning of a change in the overall labor market. As we have stated before, as long as people have jobs, they can continue to spend money. The overall consumer has remained resilient throughout the past 2 years despite incredibly high inflation.
Meanwhile The Conference Board’s leading economic indicator (LEI) continued its decline with the numbers released in June. It has now declined 14 consecutive months, and 15 of the past 17. This is by far the longest streak of declines since it declined from June 2007 to April 2009. “The US LEI continued to fall in May as a result of deterioration in the gauges of consumer expectations for business conditions, ISM® New Orders Index, a negative yield spread, and worsening credit conditions,” said Justyna Zabinska-La Monica, Senior Manager, Business Cycle Indicators, at The Conference Board. “The US Leading Index has declined in each of the last fourteen months and continues to point to weaker economic activity ahead. Rising interest rates paired with persistent inflation will continue to further dampen economic activity. While we revised our Q2 GDP forecast from negative to slight growth, we project that the US economy will contract over the Q3 2023 to Q1 2024 period. The recession likely will be due to continued tightness in monetary policy and lower government spending.”

Stock prices are used as a leading indicator for this. It was one of only 2 positive contributions (out of 10) to the index, along with new private housing building permits.
Many recession indicators have been flashing warning signs for several months going back to last year. We haven’t seen an improvement in those signals this year despite many economists now believing we’ll get through this period now without a recession. The belief, as is typical before recessions, is that “this time is different”. That very well could be true, many of the policies in 2020 and 2021 that injected incredible amounts of money and liquidity into the system could have distorted things. And even if we are of the belief that a recession is looming, it doesn’t mean the stock market has to see a big decline. Price is the number one indicator, and the market may not care about a shallow drop in the economy that may be isolated to just a few areas. There are countless possibilities from here, which is why we don’t try to predict things, we react.
One thing to keep in mind economically that may affect consumer spending, is the restart of student loan payments happening later this summer. This coincides with the recent strike down of the President’s executive order to cancel some student debt. About 40 million Americans carry student loan debt and for many, this will be the first time they make a payment on their debt since March of 2020. Combined student loan debt totals an estimated $1.7 trillion. Recent analysis from Barclays shows that the restart of monthly student loan payments could cause a $15.8 billion monthly headwind to consumer spending, with the average debt holder having a monthly payment of about $390. It’s estimated that those who took advantage of the pause and deferred payments for 39 months, had on average more than $15,000 in additional discretionary income during this period.In Conclusion
There are aspects about this market currently to get excited about, and others that signal caution. Both bulls and bears can present compelling arguments for why the market will go up or down from here, with many possibilities in between. We will continue to not pick a side to predict what will happen from here and instead rely on our risk management strategies. As always, we’ll do our best to keep clients apprised of what we’re seeing and how we’re reacting. Please reach out to us with any questions or concerns.
We hope everyone has a safe and enjoyable 4th of July holiday, celebrating this great country and its independence!
Cory McPherson is a financial planner and advisor, and President and CEO for ProActive Capital Management, Inc. He is a graduate of Kansas State University with a Bachelor of Science in Business Finance. Cory received his Retirement Income Certified Professional (RICP®) designation from The American College of Financial Services in 2017.
Disclosure