April 7, 2025

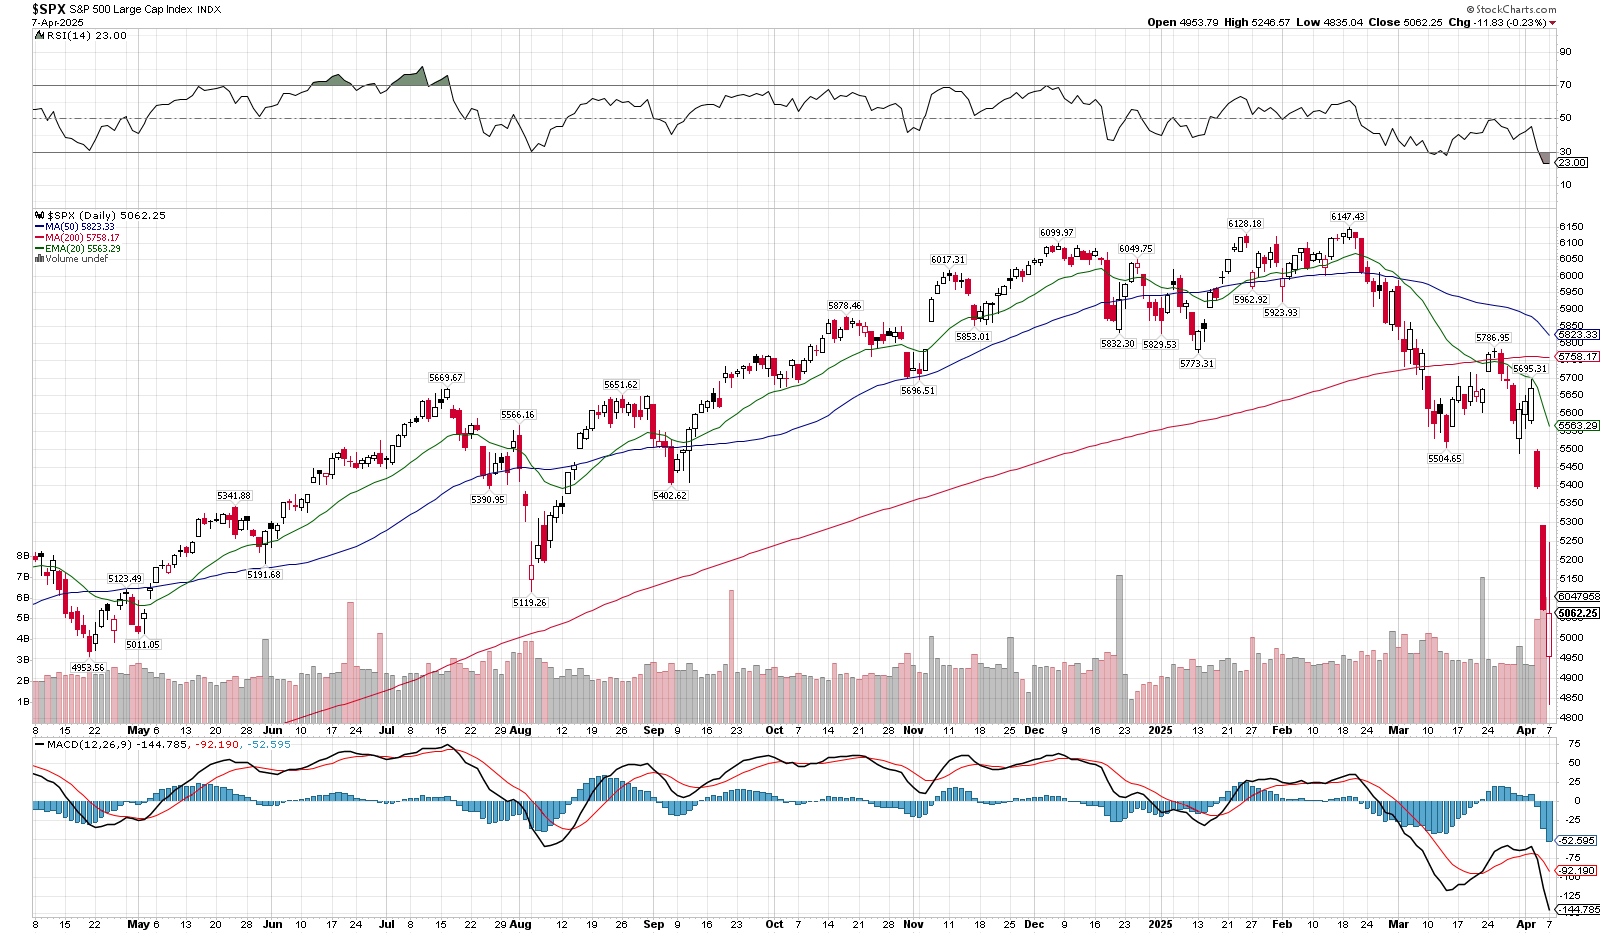
It is often said the stock market takes the staircase up and the elevator down. That has clearly been seen in the action over the last few trading days as the tariff news has served as a catalyst to the downside. The S&P 500 quickly approached what pundits describe as bear market territory when it gets to a 20% drop from its high. Is this long-running bull market coming to a close? Time will tell, but the long-term chart is showing some damage. Meanwhile, wild swings in either direction will continue until the market finds its footing. Just today, the S&P 500 traded in a 400-point range.
In the short term, with the speed and depth of this decline, a quick move higher wouldn’t be a surprise. Some of the technical indicators have reached levels last seen during the covid crash days of March 2020. It has fallen well below its moving averages. Any move higher on the S&P 500 will find resistance in the 5,500-5,800 area. That is where the market traded in a range for a few weeks before the washout began last week and a cluster of moving averages reside. I’ll look for that area as a spot to continue reducing risk across portfolios if that resistance does hold.

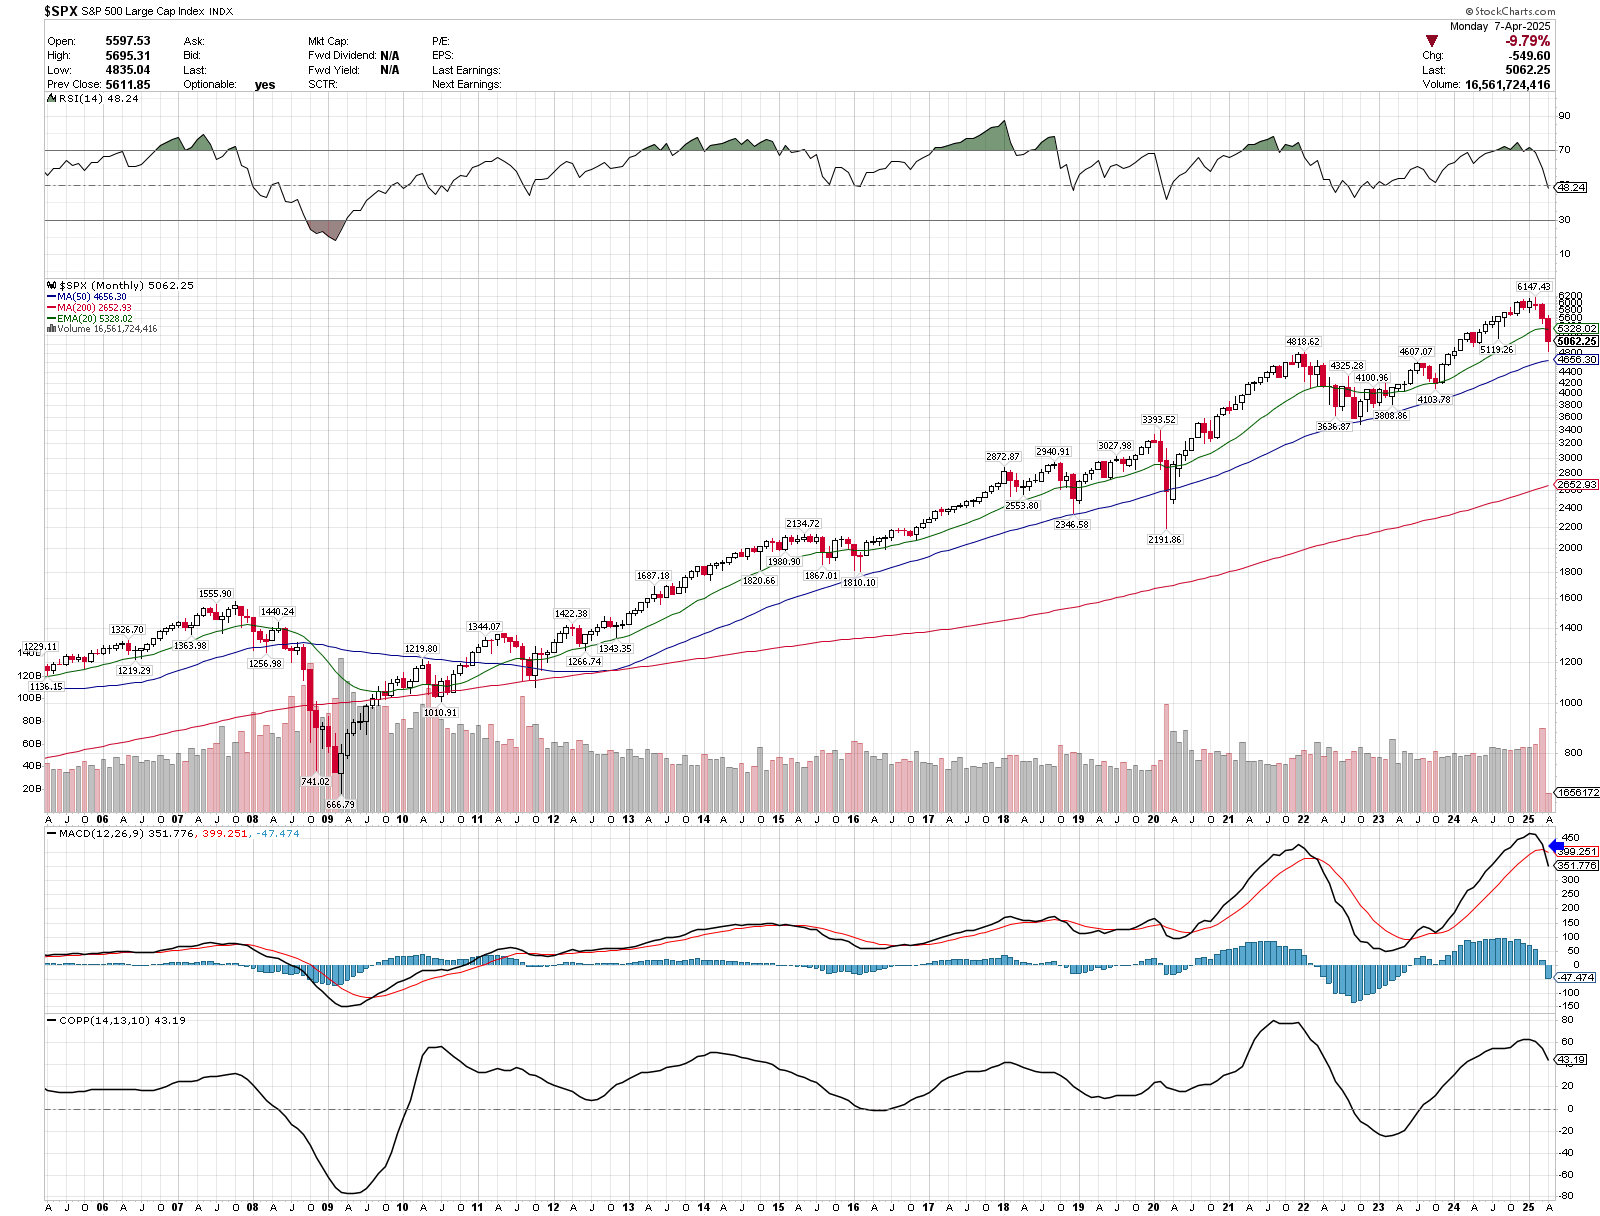
In my last newsletter, I pointed out the long-term monthly chart on the S&P 500 and how one of its indicators was about to cross negative. We did get that cross and it is shown in the chart below, 2nd panel from the bottom. This means any rally will be faced with headwinds from this long-term technical perspective. Best case scenario this negative cross is short lived and we see a strong enough rally over the next few months to turn it back positive. I’m not expecting it, but understand it is possible, especially if tariff news turns around. The problem for this indicator, though, is it is at very high levels, pushing past what was seen in late 2021. Even if we do see a rebound in this, I think it just delays a bigger drop to come as this indicator needs to reset.

The blue line on this chart, the 50-month moving average, will be important to watch over the next few months. This has been the support for this bull market on a monthly closing basis. A monthly close below signals a possible trend change and increases the odds we have entered a long-term bear market. That line currently sits at 4,656 on the S&P 500.
Overall, while an upcoming short-term bounce seems likely with the washout we’ve seen, the longer-term picture looks gloomy. A cautious approach will remain prudent as long as the long-term technical indicators are going against you. Please reach out with any questions or concerns. I know this is an emotional time as the market swings day to day are extreme as it reacts to every headline and announcement concerning tariffs. I’ll continue to use our charts and indicators and react to what the market gives us.
Cory McPherson is a financial planner and advisor, and President and CEO for ProActive Capital Management, Inc. He is a graduate of Kansas State University with a Bachelor of Science in Business Finance. Cory received his Retirement Income Certified Professional (RICP®) designation from The American College of Financial Services in 2017.
DISCLOSURE
ProActive Capital Management, Inc. (PCM”) is registered with the Securities and Exchange Commission. Such registration does not imply a certain level of skill or training.
The information or position herein may change from time to time without notice, and PCM has no obligation to update this material. The information herein has been provided for illustrative and informational purposes only and is not intended to serve as investment advice or as a recommendation for the purchase or sale of any security. The information herein is not specific to any individual's personal circumstances.
PCM does not provide tax or legal advice. To the extent that any material herein concerns tax or legal matters, such information is not intended to be solely relied upon nor used for the purpose of making tax and/or legal decisions without first seeking independent advice from a tax and/or legal professional.
All investments involve risk, including loss of principal invested. Past performance does not guarantee future performance. This commentary is prepared only for clients whose accounts are managed by our tactical management team at PCM. No strategy can guarantee a profit.
All investment strategies involve risk, including the risk of principal loss.
This commentary is designed to enhance our lines of communication and to provide you with timely, interesting, and thought-provoking information. You are invited and encouraged to respond with any questions or concerns you may have about your investments or just to keep us informed if your goals and objectives change.


