July 1, 2024

As we roll into the summer months of 2024, we are starting to see some evidence of a slowdown in the economy. One of the most important areas to monitor is consumer spending, as it accounts for almost 70% of GDP (Gross Domestic Product). Through the first half of this year, consumer numbers have weakened and some retailers are warning about a slowdown in spending. So far, the stock market has not been fazed by this, in hopes that a slowdown leads to lower inflation and lower interest rates from the Federal Reserve soon.
In looking at the U.S. consumer, economists over the last few years have pointed to excess savings from COVID-era policies as boosting spending even while prices have skyrocketed. With the chart below from the San Francisco Fed, you can see that those savings have been depleted.
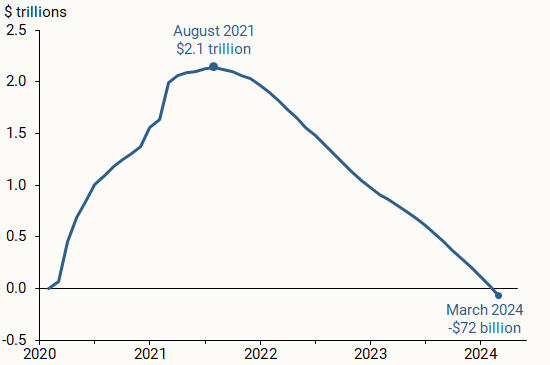
Demand for goods and services over the last few years has remained resilient despite high inflation and high interest rates, and part of what kept some consumers going is what they had built up in 2020 and 2021. Savings being dried up though doesn’t necessarily mean we see a meaningful drop in consumer spending. The problem is, it appears more consumers are adding to credit cards and other buy now pay later schemes to continue to spend. In the chart below you can see credit card debt (red line) continuing to reach all-time highs and surpassing $1 trillion. The savings rate is the blue line which has dipped below levels seen prior to the pandemic.
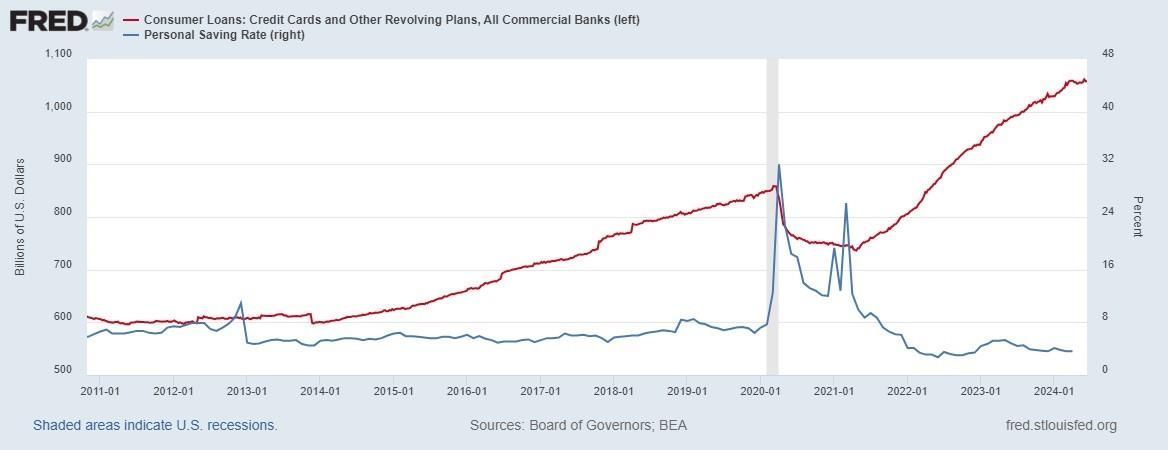
In a January 2024 report from Bankrate.com, it was revealed that 36% of U.S. adults owe more money in credit card debt than they have saved. This is the highest rate Bankrate has found in its 12 years of polling Americans and an increase from 27% the year prior. The majority of adults (55%), though, do have more in emergency savings than they do in credit card debt. The number of card holders carrying balances month to month has increased, reaching nearly half of all credit card holders. This is obviously a concern as average credit card rates reach more than 25%.
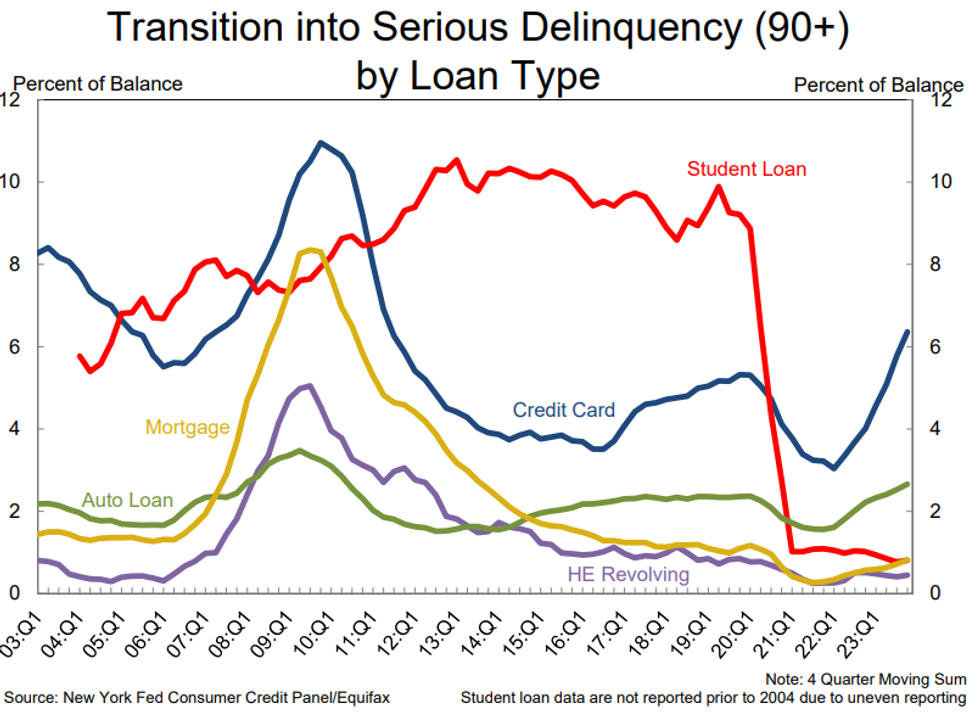
Along with higher debt levels being seen, delinquencies are rising. And not just for credit cards, but also for auto loans. The chart below shows the rise in delinquency rates by different loan types from the end of 2023. Just the trend in rising delinquencies for credit cards and auto loans is more worrisome than the number. These lines have been increasing while the economy has been near full employment and asset prices have been high. Both credit card and auto loan delinquencies are reaching levels seen at the start of the great recession in 2007. Mortgage delinquencies, while they have risen, remain lower than before the pandemic.
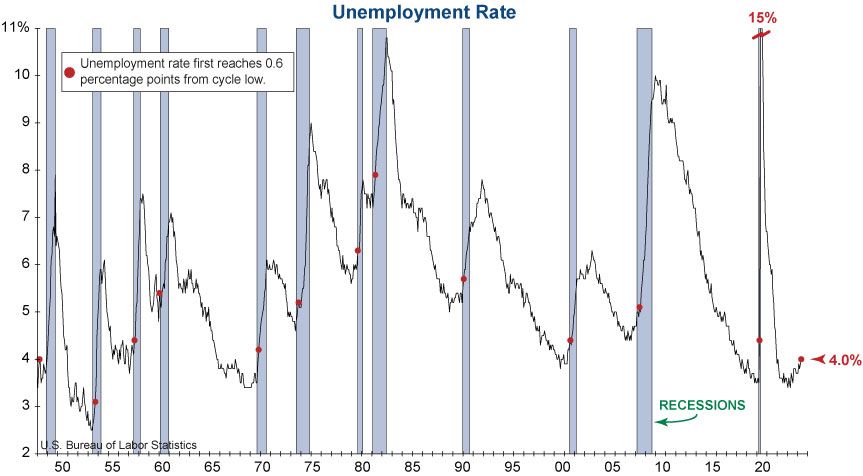
Jobs and employment are clearly important going forward to keep consumers going. As long as people have a job if they want one, they will feel like they can continue to spend at their current levels. With the recent May jobs report, the unemployment rate did tick up to 4.0%. While still historically low, it is now 0.6% higher than its cycle low of 3.4%. Why is this important? Increases of 0.6% from a cycle low have preceded each of the last 12 recessions, with just one false signal in 1959.
Many retailers in the last quarter have warned about consumer spending during their earnings calls. Target reported same stores sales declined 3.7% for their first quarter. They remain cautious in their near-term growth outlook and that discretionary spending would remain under pressure for the coming months. Target is planning to lower prices targeting lower-end consumers this summer, something Walmart also announced they would plan to do. Walgreens also slashed its full-year earnings outlook and describes a “worse-than-expected” consumer environment. Nike recently reported quarterly earnings showing year over year revenues declining. They are planning a cut of $2 billion in costs and dropping 2% of its workforce.
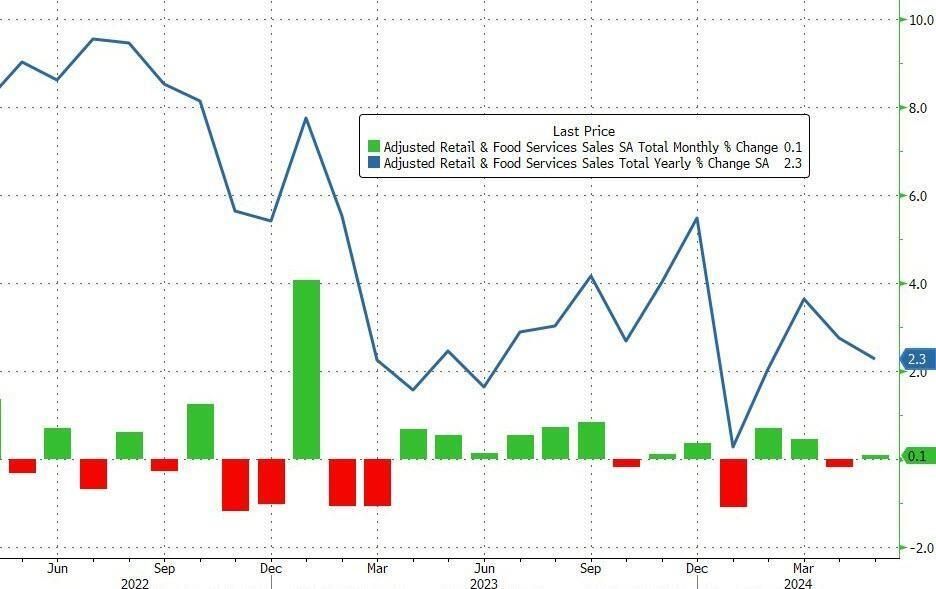
Overall, retail sales in the month of May rose just 0.1% after being down 0.2% in April. If you take out automobiles, sales actually declined 0.1% in May. On a year-over-year basis retail sales were up 2.3%. The trend in the year-over-year change continues downward after the large boost from the post-pandemic era spending.
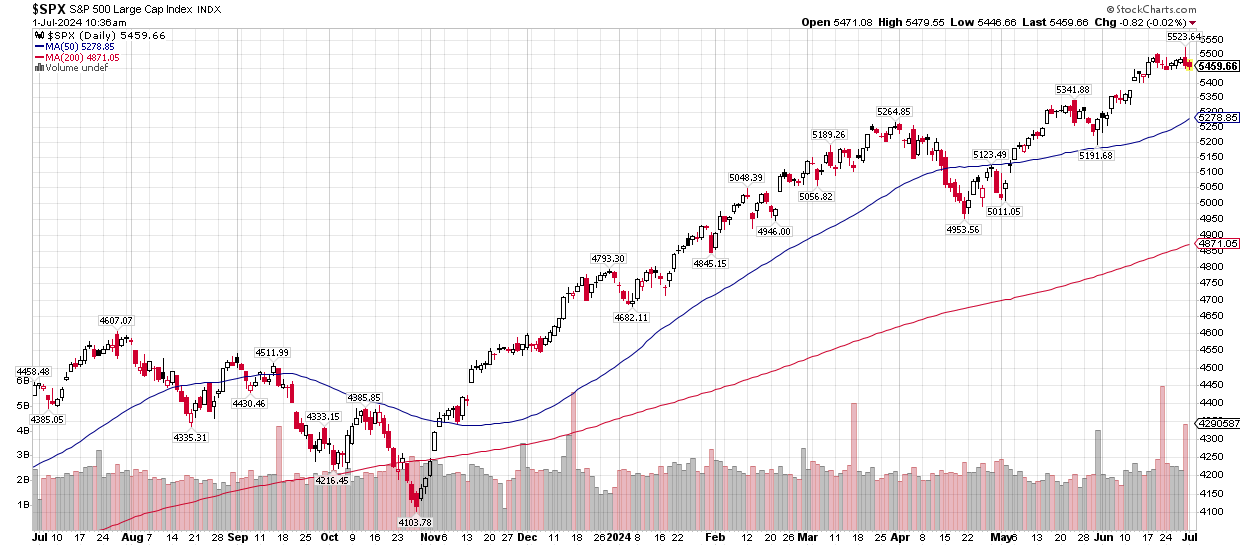
Despite signs of a slowing economy, the S&P 500 continues to march higher. Much of what has driven the market since early May has been the big tech stocks again, namely Nvidia. While there are signs of waning momentum and complacency in the market, price remains elevated and near all-time highs. We are coming up on a seasonally weaker period later in July that leads up to the election. A correction similar to last year’s late summer/fall period wouldn’t be surprising and would be healthy for the market after such a long run.
As mentioned, much of this recent charge higher in the market has been led by just a few stocks. Market breadth has been an off and on problem for the last few years now. Much of the initial rally off the lows in late October last year saw healthy participation. Things started to change in March as breadth measures began to weaken and have not recovered even as the market went on to new highs. This typically resolves by either seeing some type of corrective move in the index, or improvement in market breadth as money rotates into other areas and continues to support the index higher.
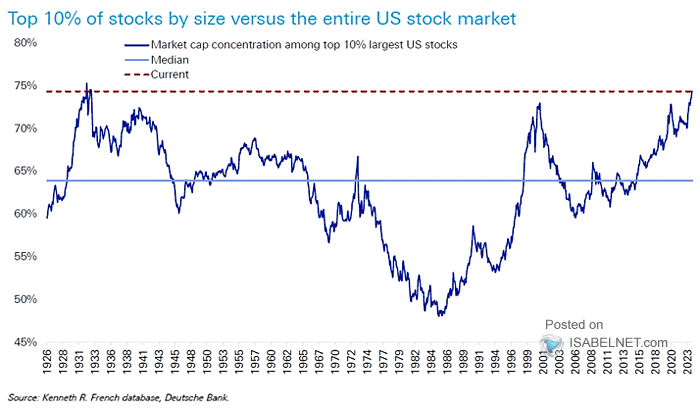
However, long term, whenever the high concentration begins to unwind, it will not be pretty for the overall stock market based on previous peaks. Previous high peaks of concentration in the stock market occurred in 2000 and 1929, not years the market wants to be associated with. This party may continue on for a while and concentration may become even more extreme. But it will eventually end at some point and there will be an unwind in the high concentration stocks. Ideally it would provide opportunities elsewhere.
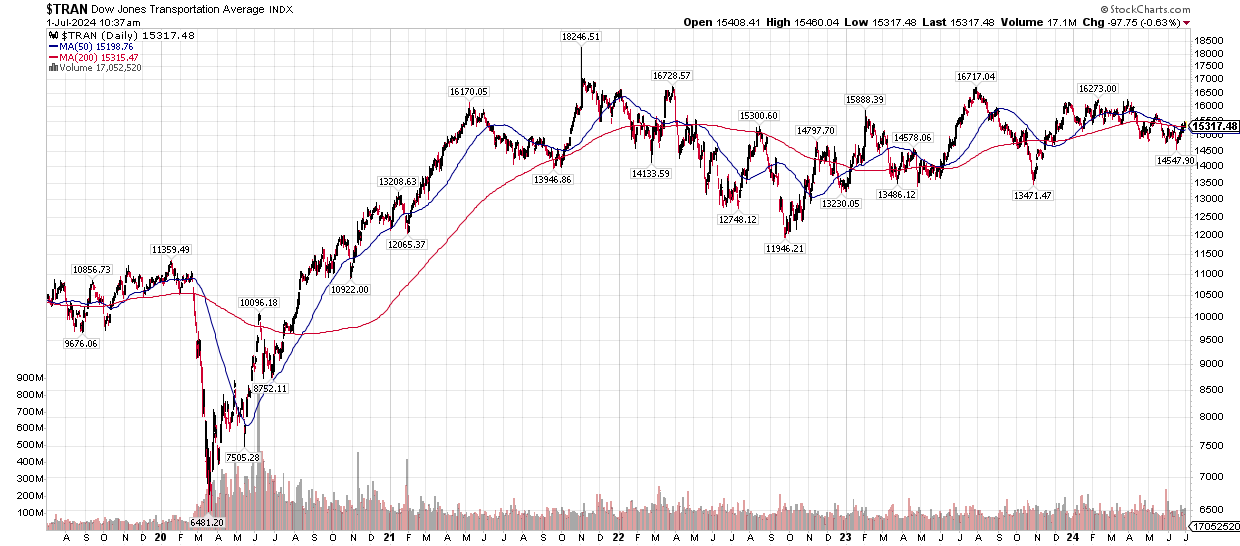
One area of the market to watch is the transportation sector. I’ve highlighted in previous newsletters its importance as a market gauge of the economy. It peaked earlier this year in March and has been in a downtrend since. I would like to see this stabilize above its lows from last October and begin a rally to help support the overall market’s advance.
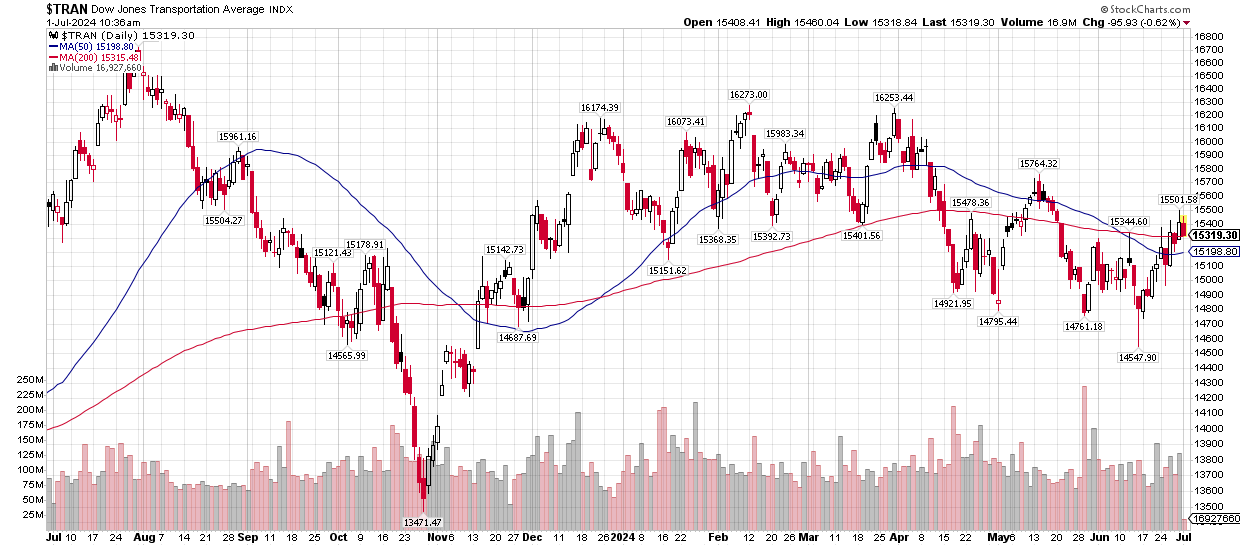
You can see from a longer-term perspective how transports have been in a choppy sideways pattern since 2021. It appears to be coiling up in anticipation of a move one way or another.
Another area of the market that I’ve highlighted before, small caps, continues to lag. Small caps need to begin to participate to give more confidence in a longer-term uptrend. Like transports, small caps remain below their March high, and still well below their 2021 peak. If we do see some type of corrective move lower in the next few months in the indexes, a broad-based rally afterward with small-caps leading would give confidence to a continuation of an uptrend since the lows in 2022.
In closing I wanted to share some personal news. As some of you know, my family welcomed our 3rd child on June 13th, a healthy boy, Walker Martin McPherson. Everyone is doing great and our family is adjusting to now being a family of 5!
We wanted to wish everyone a safe and happy July 4th! Our office will be closed on Thursday the 4th and Friday the 5th.
Cory McPherson is a financial planner and advisor, and President and CEO for ProActive Capital Management, Inc. He is a graduate of Kansas State University with a Bachelor of Science in Business Finance. Cory received his Retirement Income Certified Professional (RICP®) designation from The American College of Financial Services in 2017.
DISCLOSURE
ProActive Capital Management, Inc. (PCM”) is registered with the Securities and Exchange Commission. Such registration does not imply a certain level of skill or training.
The information or position herein may change from time to time without notice, and PCM has no obligation to update this material. The information herein has been provided for illustrative and informational purposes only and is not intended to serve as investment advice or as a recommendation for the purchase or sale of any security. The information herein is not specific to any individual's personal circumstances.
PCM does not provide tax or legal advice. To the extent that any material herein concerns tax or legal matters, such information is not intended to be solely relied upon nor used for the purpose of making tax and/or legal decisions without first seeking independent advice from a tax and/or legal professional.
All investments involve risk, including loss of principal invested. Past performance does not guarantee future performance. This commentary is prepared only for clients whose accounts are managed by our tactical management team at PCM. No strategy can guarantee a profit.
All investment strategies involve risk, including the risk of principal loss.
This commentary is designed to enhance our lines of communication and to provide you with timely, interesting, and thought-provoking information. You are invited and encouraged to respond with any questions or concerns you may have about your investments or just to keep us informed if your goals and objectives change.


