September 28, 2023

As we begin to turn the page on another month, and another quarter, the market enters the final quarter of the year on shaky ground. As was outlined in our last report, September- a historically poor month for the market- has seen the drop in the market continue. It’s beginning to close in on levels in the S&P 500 that a typical correction would drop to. I’ll outline what I’m seeing, the important levels of the market, and what may lie ahead in the short term and long term.

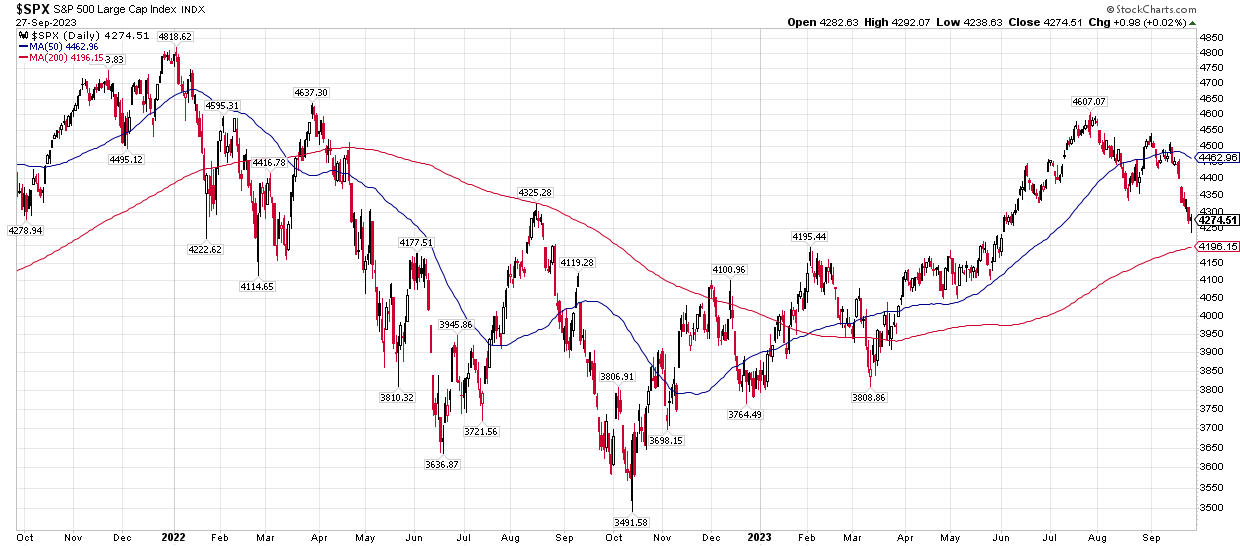
This S&P 500 chart goes back 2 years, showing the 50-day moving average in blue and 200-day moving average in red. Clearly, the 50-day did not hold as a line of support earlier in the month and the market has taken a direct route towards the 200-day moving average. If the market continues to drop, the 4205 level (very near the 200-day moving average) on the S&P will be an important line of support. If the market continues to stay above that level, then it seems more probable that this has been a correction, leading to another rally higher.
If that level does not hold, then it could be signaling another important top in the market has been made from where it was in late July, and a possible resumption of the bear market from 2022. If that were to occur and the market would continue to drop below the 200-day moving average, then a retracement rally would be used to reduce risk. If a rally were to look corrective after such a drop, then it would be another signal that the market may have peaked in late July.
If the market holds support, then a push higher in the 4th quarter will first need to exceed the previous swing high, around 4600, and then will look to challenge the highs made in late 2021, around 4800. That will be an important area of resistance if it gets there.
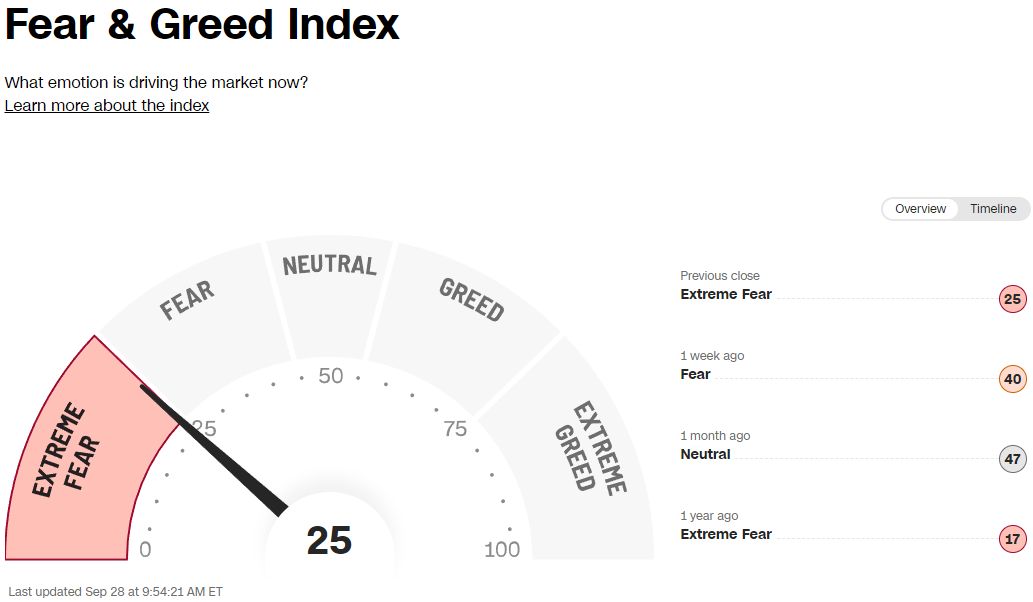
What could fuel this next push higher for the market may be the shift in sentiment. In late July many sentiment indicators were showing extreme bullishness in the market. That has completely changed as sentiment in the market is becoming extremely bearish. As I’ve explained before, extremes in either direction can be dangerous and lead to the opposite of what the herd is expecting or preparing for. Activity in the options market reflect levels of bearishness typically seen near low points in the S&P 500. Many more traders are attempting to short the market than go long and, like other sentiment indicators, has seen a dramatic shift from positive to negative sentiment in just a couple of months.

Source: https://www.cnn.com/markets/fear-and-greed
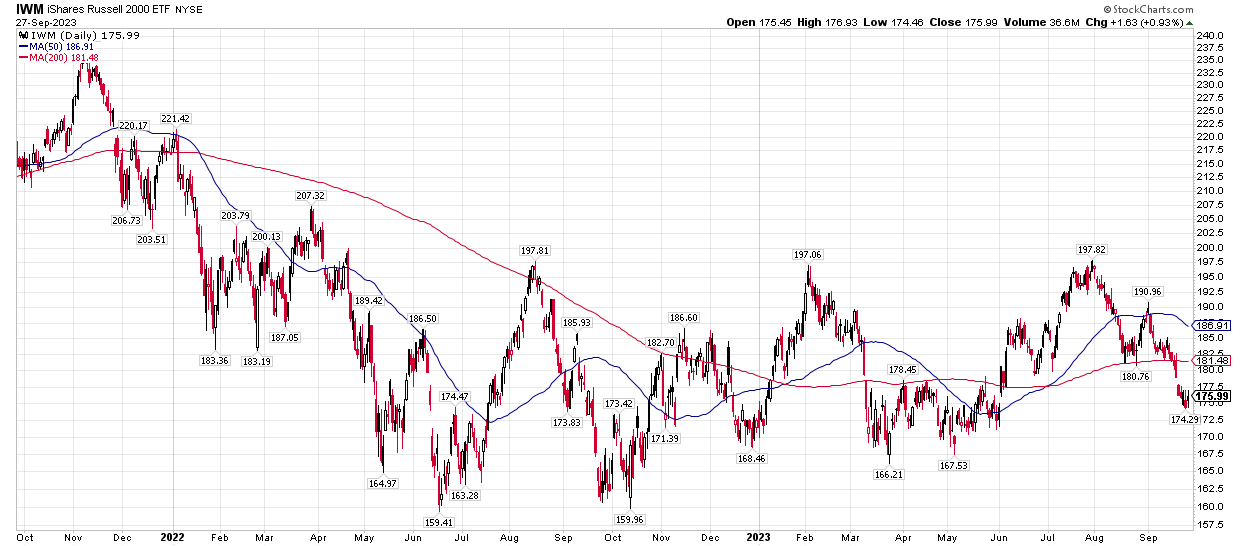
Even with such a shift in sentiment, looking at the market longer-term, this still doesn’t appear to be the beginning stages of a multi-year bull market run with how this year has played out. One concern that I’ve pointed out before is looking at small caps. These smaller-sized companies are much more economically sensitive than the large cap companies of the S&P 500. Looking at a chart of a small cap index fund below, you can see it’s not far above its lows from last year.

It's possible to see the S&P push higher and make new highs while the small caps, and many other areas of the market, do not make new highs or even come close. That’s not a sign of a healthy market or one that is in the early stages of a longer-term bull market run. Because of that, a rally in the S&P to end the year may not be an all-clear signal.
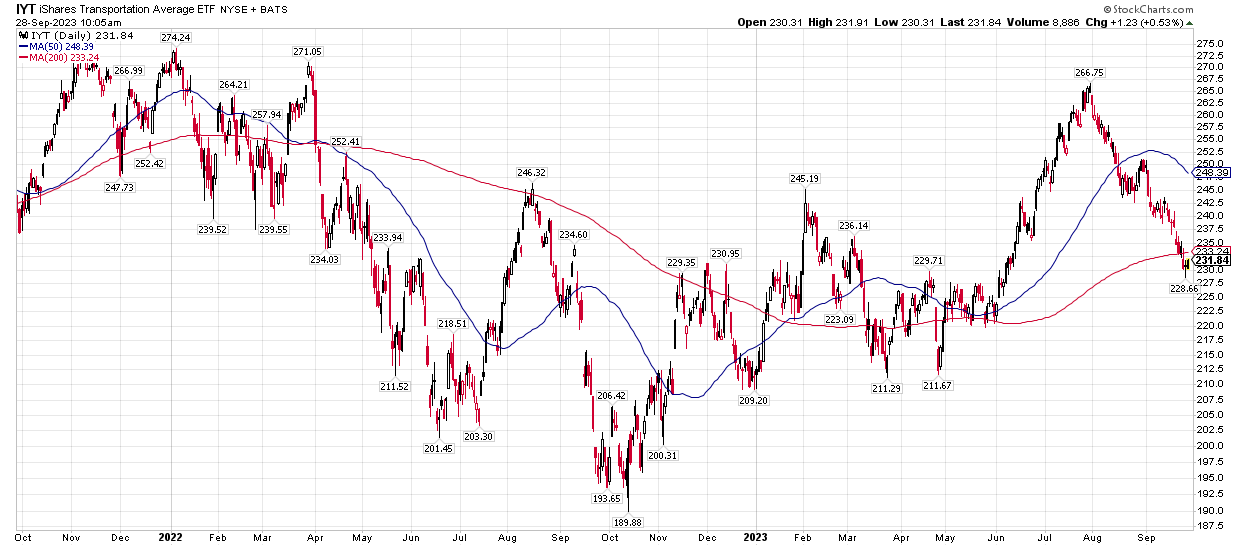
Transports, an important part of the economy, has quickly given back the gains it made over the summer. As it began to break out in June, it was signaling improvement in the economy. It now may be signaling that was a false breakout, and a failed attempt to make a new high with its next rally would be another warning sign.

As you can see below, banks have continued their slide this month as well. This chart, of course, continues to look unhealthy. As interest rates remain high, it continues to put stress on banks and the banking system.

What came as basically no surprise last week, the Federal Reserve decided to keep interest rates the same. They signal the possibility of one more hike before the end of the year. Their dot plots of where they expect interest rates to be in the future would suggest that either they are done hiking interest rates, or they will have one more. They also expect less in rate cuts over the next 2 years than what expectations were, meaning the Fed now sees rates higher for longer as they have warned about before.
It’s hard to believe, though, in what the Fed projects for interest rates into the future, as their crystal ball isn’t as good/bad as anybody else’s. Remember in 2021 they were saying repeatedly that inflation was “transitory,” and delayed for many months any moves in interest rates. Even into early 2022 they were not projecting having to raise interest rates but more than a couple of percentage points. We all know how that has turned out. Their policy of where interest rates are set will continue to be based on inflation and economic/unemployment numbers, many that are backward-looking. If inflation remains elevated and well above their 2% target, the harder it will be for them to begin any type of cutting/easing program. As has been pointed out previously, this hiking cycle has been at a faster pace than ever before, and many of the lagging effects of interest rates will continue to be felt through the economy as time passes.
One concern that many have is the looming possibility of a government shutdown and its effects on the market. I am not sure, and no one can predict how that will play out, or how any other world “event” may play out. So, it’s not something to make decisions based on. We’ll use the charts and the ultimate indicator of price to help with decision making. Events can serve as a catalyst for a move one way or another, but using charts and indicators will help us in determining that, not a headline.
In summary, if the market can hold support lines in the short term, then it’s more probable we will get another rally that could take the S&P near its all-time high. On a long-term basis, I believe the picture remains quite cloudy. Because of that it will remain prudent to have active management. Just because a market index may struggle over the next few years doesn’t mean all parts of the market will. I believe we have the tools and indicators in place to help us navigate what could be a continuous bumpy ride.
Cory McPherson is a financial planner and advisor, and President and CEO for ProActive Capital Management, Inc. He is a graduate of Kansas State University with a Bachelor of Science in Business Finance. Cory received his Retirement Income Certified Professional (RICP®) designation from The American College of Financial Services in 2017.
DISCLOSURE
ProActive Capital Management, Inc. (PCM”) is registered with the Securities and Exchange Commission. Such registration does not imply a certain level of skill or training.
The information or position herein may change from time to time without notice, and PCM has no obligation to update this material. The information herein has been provided for illustrative and informational purposes only and is not intended to serve as investment advice or as a recommendation for the purchase or sale of any security. The information herein is not specific to any individual's personal circumstances.
PCM does not provide tax or legal advice. To the extent that any material herein concerns tax or legal matters, such information is not intended to be solely relied upon nor used for the purpose of making tax and/or legal decisions without first seeking independent advice from a tax and/or legal professional.
All investments involve risk, including loss of principal invested. Past performance does not guarantee future performance. This commentary is prepared only for clients whose accounts are managed by our tactical management team at PCM. No strategy can guarantee a profit.
All investment strategies involve risk, including the risk of principal loss.
This commentary is designed to enhance our lines of communication and to provide you with timely, interesting, and thought-provoking information. You are invited and encouraged to respond with any questions or concerns you may have about your investments or just to keep us informed if your goals and objectives change.


