
In my last newsletter in January, I highlighted how the S&P 500 had been moving in a back-and-forth action without much gain or loss. The sideways action continued for the most part in February as well. We reached an all-time high in the S&P at 6,147.43 this month, yet we are closing in on the end of the month and it currently sits about where it started the year at. This choppiness has heightened volatility and uneasiness in the market. Sentiment on the market has soured as well, and I’ll highlight one survey that shows how bearish feelings have risen. Also, in this newsletter I’ll review some figures on the housing market that could be cause for concern.
Looking at the S&P 500 chart highlights the sideways action we’ve seen since November. Right now, we are near the bottom of this pattern and may be attempting to break down. A test of the 200-day moving average near 5,700 or lower may be in the cards soon if the sideways action doesn’t hold. If support holds, we could see another rally attempt to break out and make new all-time highs again before seeing a bigger correction play out.
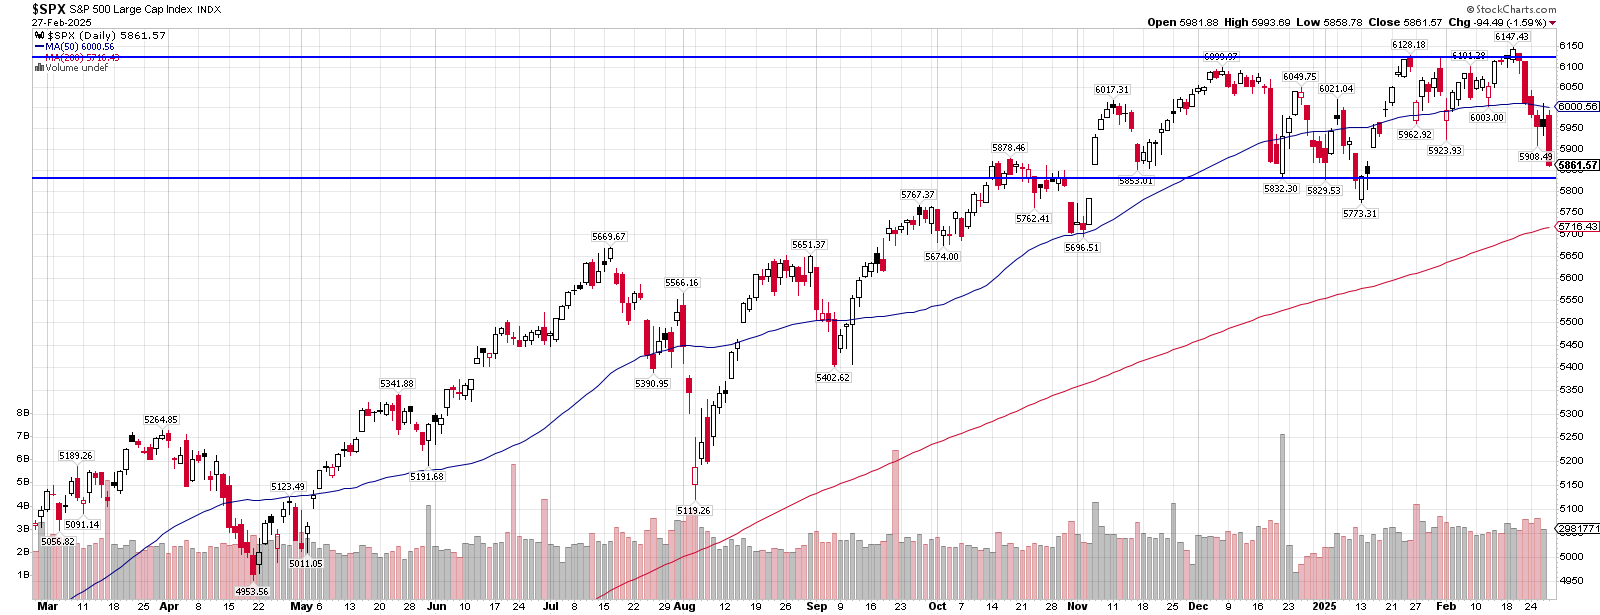
On average the S&P 500 trades above its 200-day moving average for about 6-7 months before seeing at the least a test of that average. Currently, the S&P has been above its 200-day moving average since the end of October of 2023, going on 16 months now since it last traded below it. Obviously the market has been due for some sort of drop to that region for a while now. How it reacts in that region will be important. It could show a change in the character of the market if it begins to trend below it. In October of 2023 though, after spending a few days below the average, it quickly reversed higher and began this long uptrend we’ve been on since.
A recent investment survey from AAII (American Association of Individual Investors) shows how bearish investors have become recently. AAII surveys investment sentiment weekly by asking what direction members feel the stock market will be in the next 6 months. Bullish being positive and bearish being negative on the market. This week’s readings show bearishness in the market reaching levels last seen in 2022 when the market was down nearly 20%. Typically, extreme bearish readings are seen near market bottoms, not a few percentage points from a top. There may be good reason, though, for bearish sentiment and the market may have much further to fall. If not, and we see it find support, the bearish sentiment can fuel a squeeze higher as investors attempt to get back on the right side of the tracks.
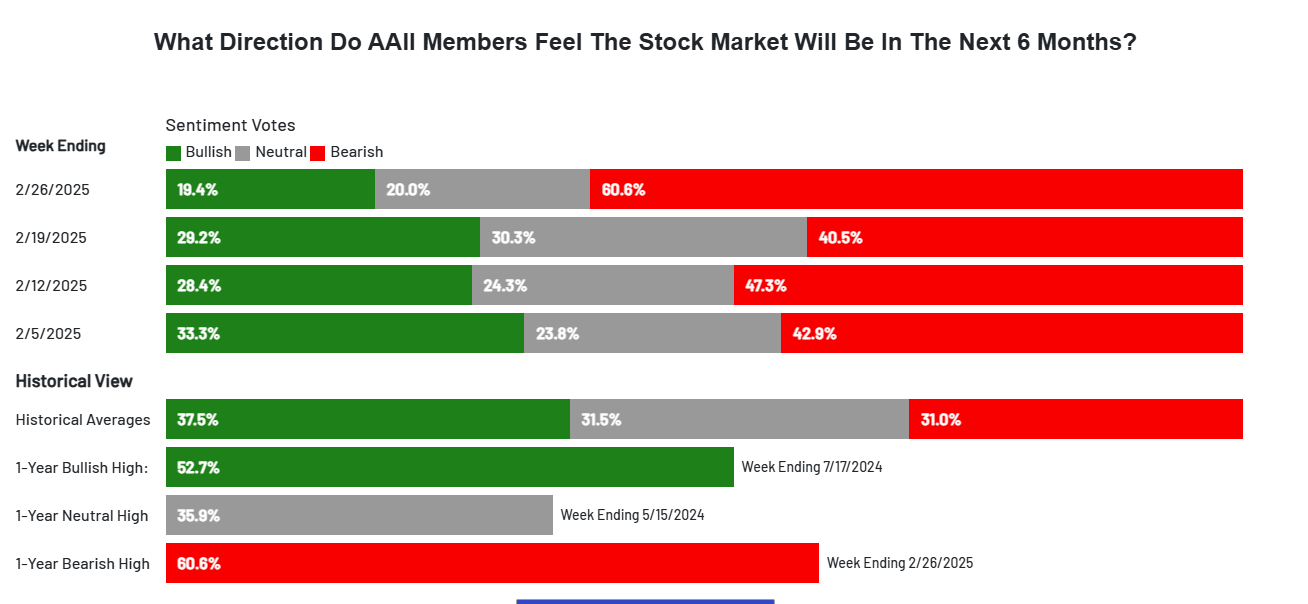
Source: aaii.com/sentiment-survey
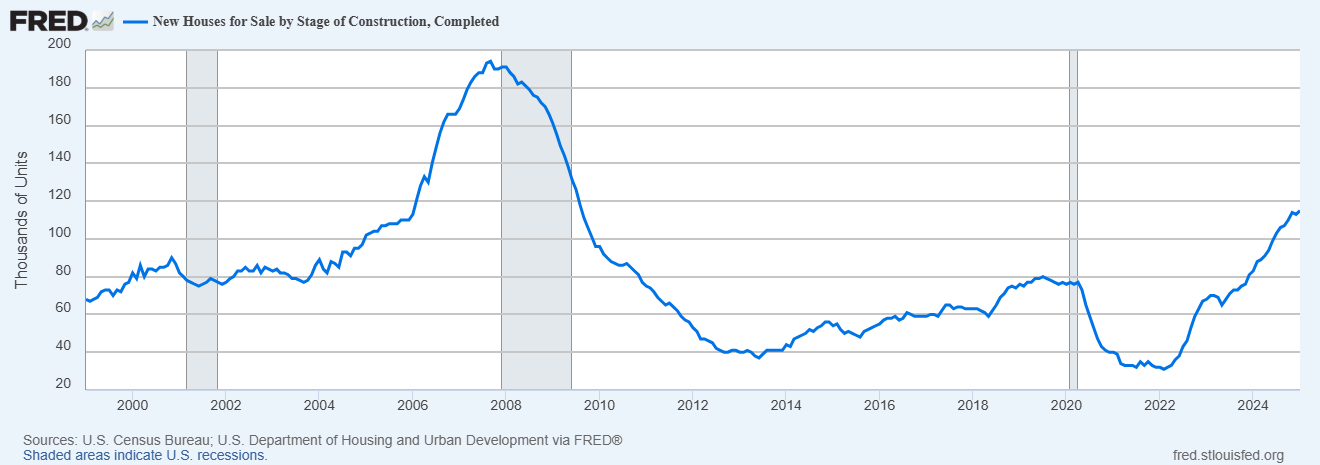
Some interesting data has come out recently on the housing market that is causing some concern for the economy. The general thought for housing over the last few years is a lack of supply and the need for more homes to be built. The lack of supply combined with ultra-low rates from a few years ago caused home values to skyrocket, especially in desirable locations.
Recent numbers show a continuing rise in completed new homes for sale after bottoming in 2021.
This is with the backdrop of continued weakening home sales. In order to avoid a glut of housing inventory, construction may need to slow down. Pending home sales in January were down 4.6% month over month after dropping 4.2% month over month in December. Year over year sales are down 5.2%. The chart below shows the pending home sales index remaining near the lows that were seen during the pandemic.
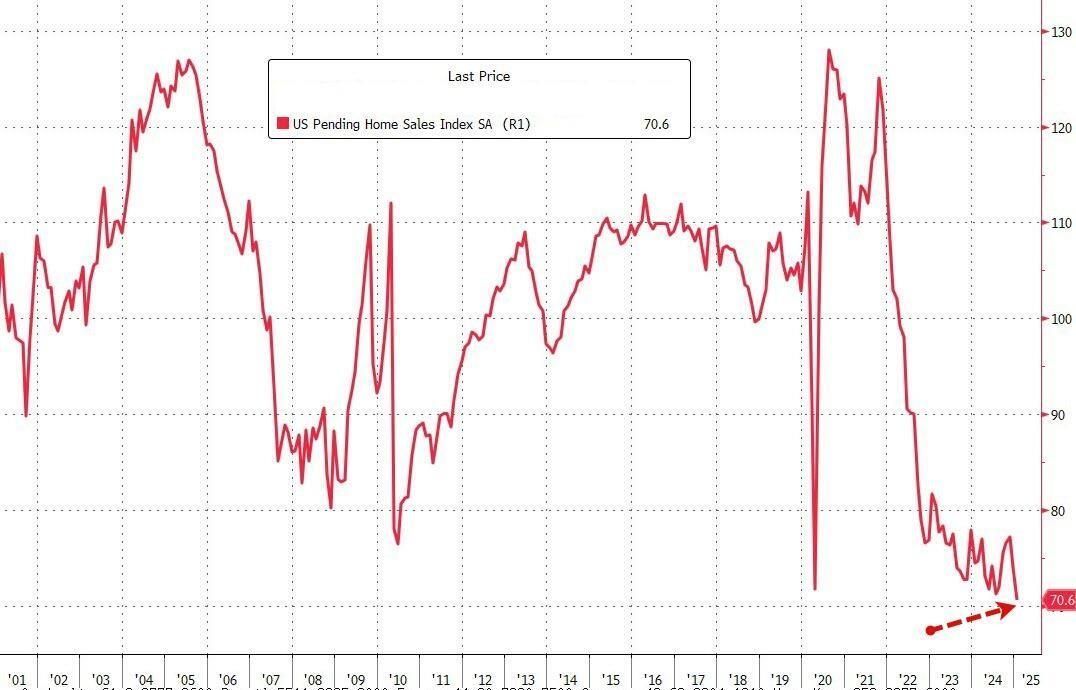
Source: Bloomberg
Home prices continue to squeeze out buyers, along with mortgage rates remaining north of 6%. National home prices were up 3.9% in December from a year earlier. The median sale price of a previously owned home in the US was $396,900 last month, according to NAR (National Association of Realtors) data. That is up 49%(!) from five years ago.
Will the increase in supply and lack of sales lead to lower home values? Obviously if you’re in the market for a new home that would be the hope, but as stated national averages have not stalled. Location matters and certain places may already be seeing that slowdown while others continue their trend.
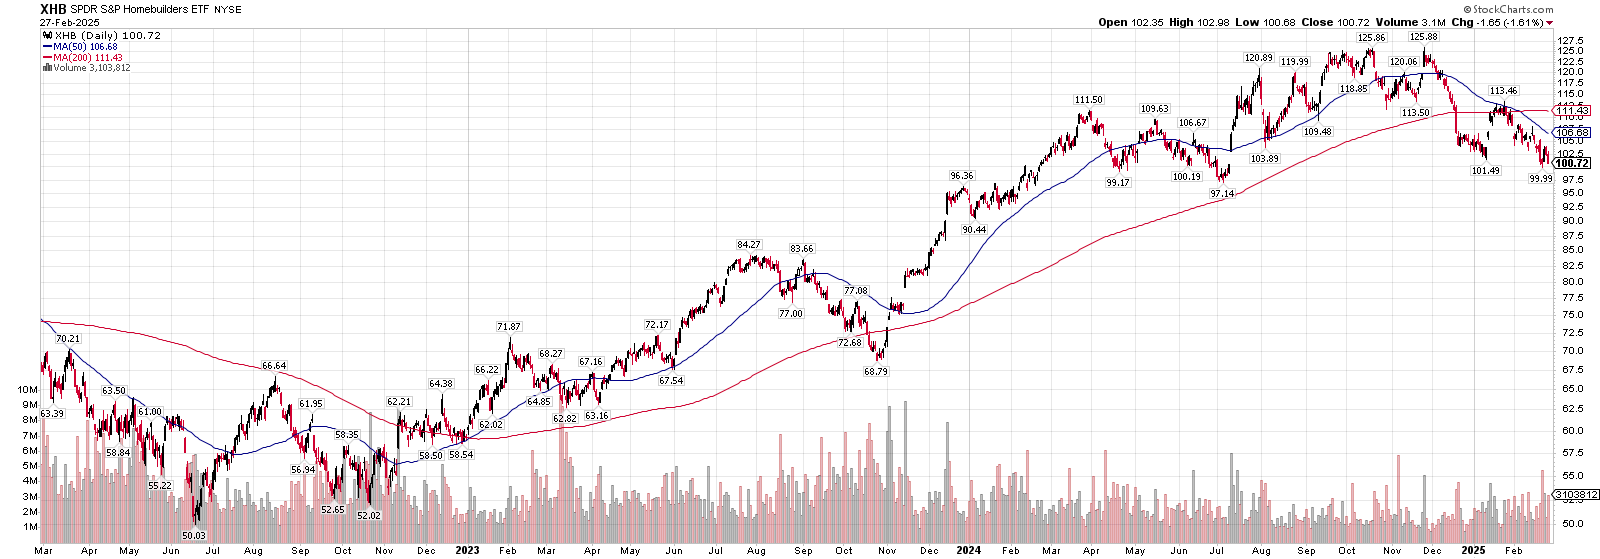
The stock prices of homebuilders have begun to trend lower since last November. The chart below shows the SPDR S&P Homebuilders ETF. This fund experienced tremendous growth from late 2022 onward. This may be a sign of the expected slowdown in home building going forward.
Overall, I believe we’re near an important point in both the market and economy. While certain data points suggest this economy can keep chugging along like it has for a little while longer, others show growth may be hard to come by. The stock market is certainly nearing an important point. Will it be able to hold support and have another rally back to the highs, or do we finally see a breakdown and bigger drop play out? Time will tell, but we’ll be prepared for whichever scenario plays out.
Cory McPherson is a financial planner and advisor, and President and CEO for ProActive Capital Management, Inc. He is a graduate of Kansas State University with a Bachelor of Science in Business Finance. Cory received his Retirement Income Certified Professional (RICP®) designation from The American College of Financial Services in 2017.
DISCLOSURE
ProActive Capital Management, Inc. (PCM”) is registered with the Securities and Exchange Commission. Such registration does not imply a certain level of skill or training.
The information or position herein may change from time to time without notice, and PCM has no obligation to update this material. The information herein has been provided for illustrative and informational purposes only and is not intended to serve as investment advice or as a recommendation for the purchase or sale of any security. The information herein is not specific to any individual's personal circumstances.
PCM does not provide tax or legal advice. To the extent that any material herein concerns tax or legal matters, such information is not intended to be solely relied upon nor used for the purpose of making tax and/or legal decisions without first seeking independent advice from a tax and/or legal professional.
All investments involve risk, including loss of principal invested. Past performance does not guarantee future performance. This commentary is prepared only for clients whose accounts are managed by our tactical management team at PCM. No strategy can guarantee a profit.
All investment strategies involve risk, including the risk of principal loss.
This commentary is designed to enhance our lines of communication and to provide you with timely, interesting, and thought-provoking information. You are invited and encouraged to respond with any questions or concerns you may have about your investments or just to keep us informed if your goals and objectives change.