
It feels like spring has sprung here in Kansas, but it appears no one has told the stock market. Just a month ago in my previous newsletter I showed how the S&P 500 had been in a sideways pattern since November and waiting for a break either up or down. Not long after, it broke down and has failed to muster any sustained bounce. While the short-term looks murky, the long-term charts are looking weak as well. In this newsletter I’ll highlight a monthly signal that is on the verge of going negative for the first time since early 2022 and what that may mean.
Looking at the S&P 500 over the last 12 months in the chart below, you can see in early March it broke below the 200-day moving average (red line) for the first time since October 2023. As I said in February’s newsletter, the market was overdue for a test of that average. What’s concerning in the short term is the S&P’s inability to get back above it with conviction. You can see it traded above it for a short amount of time on Monday, March 24th and Tuesday, March 25th but was unable to hold. We are now back below it and with today’s action (Friday, March 28th) we’ve returned back near the point of where that attempted breakout began.
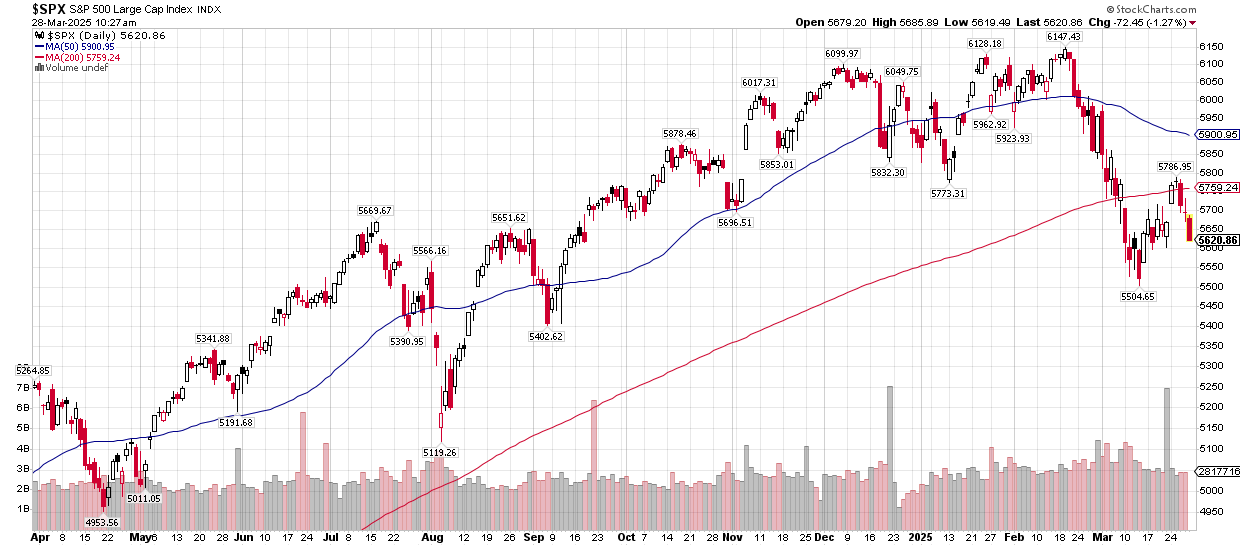
From the market peak in mid-February to the bottom in mid-March we saw about a 10% drop. Nothing out of the ordinary as it can be labeled as a market correction if the S&P can regain its footing. However, all bigger corrections/bear markets obviously begin with some sort of initial drop like this, and after a failed rally attempt continues to make lower lows. I’ll be watching the 5,800-5,850 area as resistance if the S&P starts another rally attempt. That would be about a 50% retracement of the 10% decline. Historically, when bigger draw downs occur that is the area of resistance for relief rallies. It doesn’t have to get there and we did get close earlier this week, but a failed attempt at that signals a weak market.
Looking at a long-term monthly chart on the S&P 500 below, the third panel shows an indicator (MACD) on a monthly basis that I follow, especially when the market begins to experience some turbulence. It’s a negative signal when the black line crosses below the red line. This only updates on a monthly basis, so without a surge here to end the month it very well could cross next week. Even if it doesn’t at the end of March, it will still likely turn negative at some point in the next few months. You can see that the indicator has reached a higher point than it did in 2021 and highlights the exhaustion to the upside we’ve had. Both of those peaks are much higher than the previous peaks since this bull market started post 2009. The vertical lines show the previous times where this has crossed which includes 2022, 2020, 2018, and 2015.
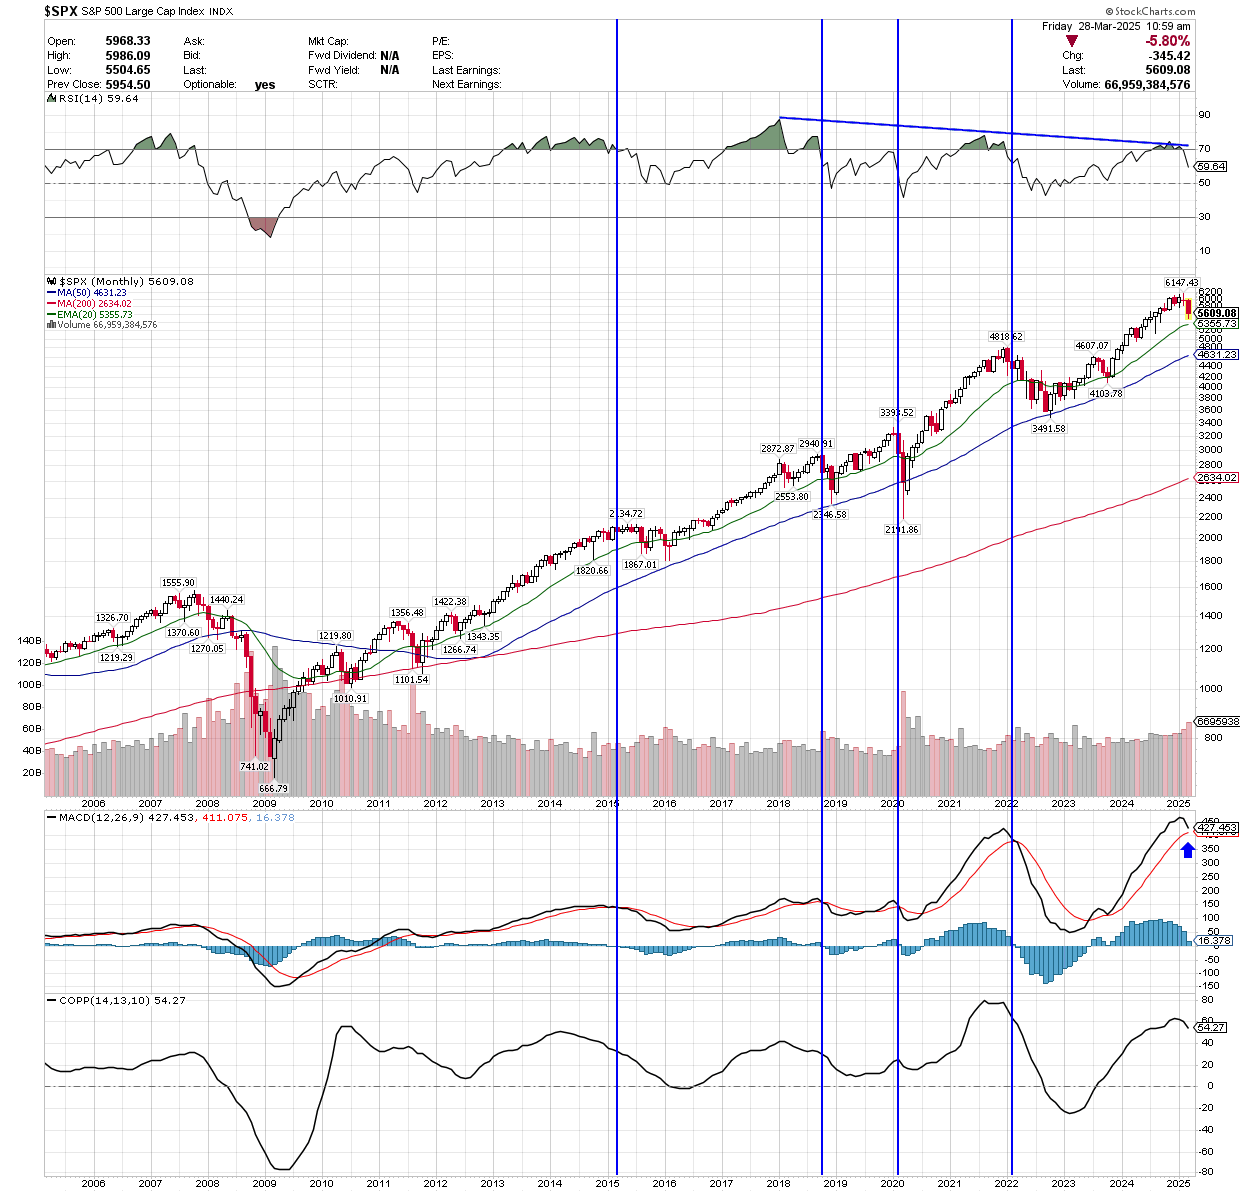
Since the S&P 500 made new all-time highs in 2013 following the great recession the blue line in this long-term chart has been support for the S&P on a monthly close. You can see after each negative cross in the MACD indicator the market came near the blue line (50-month moving average), sometimes piercing below but finishing at or above it on a monthly close each time. Right now, that line sits at 4,631 on the S&P. A lot of air exists between where we are now and that level. If we see continued weakness and a bigger drop playing out, that is the long-term support level to watch. I wouldn’t expect a direct drop to that area like what happened in 2020 during the Covid crash, but something similar to 2022 that drags on for a few months is possible. In that case there were periods when the market provided opportunities to reduce risk and exposure.
If a bigger drop and bear market is playing out, that blue line will be important. To me it would signal whether this is a cyclical (short-term) bear market, or we have a change in character and this is the beginning of a secular (long-term) bear market and the cycle that began post 2009 has completed. The top panel on the long-term chart above shows the RSI (relative strength index) which has peaked at a lower level each time the S&P has peaked at a higher level. This is a long-term negative divergence signal that I’ve highlighted before and similar to what the market experienced before the tech bubble popped in 2000.
This next chart shows the volatility index (VIX) over the last 4 years. In looking at it recently you can see the climb that it’s had, reaching as high as 29 earlier this month. But it did it in what may be considered an “orderly” fashion for this index. We never saw a sudden spike in volatility and ultimately peaked at a similar level as it did in December. I don’t see that necessarily as a positive though, and looking at 2022 can show why. The peak in the VIX occurred early that year in what can be considered a similar move. It then moved in a sideways range without ever experiencing a big spike to the upside, as the market continued to trend down for about 10 months.
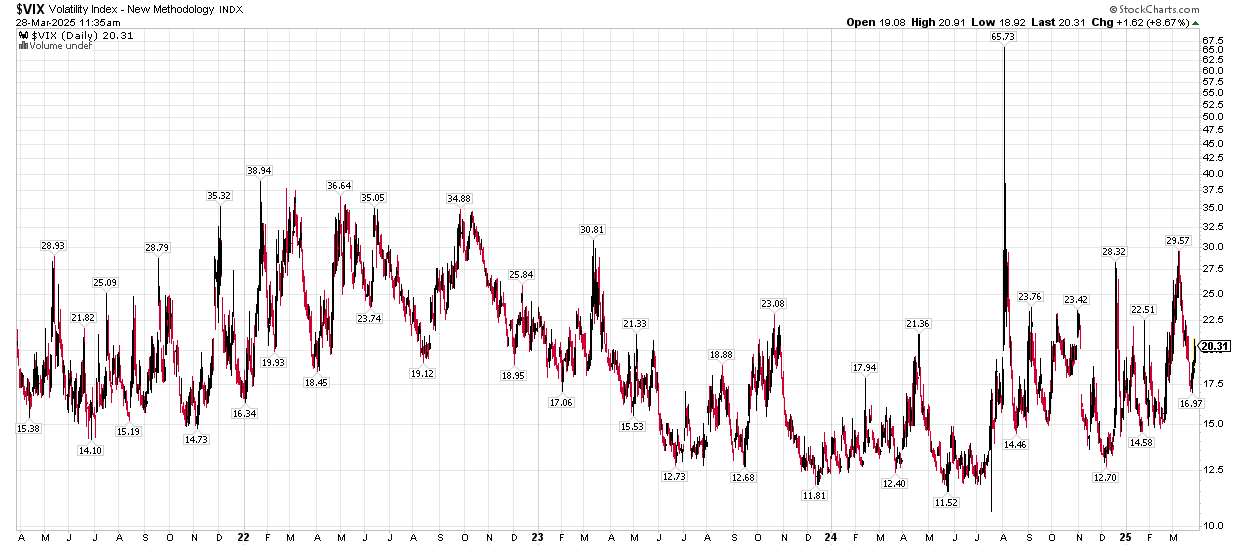
Historically, the large spikes like we saw as recently as last August have been exhaustion points for sellers and marked bottoms. We saw it in 2020 during the Covid crash and even in 2015 and 2018. The 20 level on this index historically has been key. We’re near that level currently and if it stays near that level or below it for a period of weeks and months it can provide relief for the stock market.
Overall, there is a lot of uncertainty right now and anxious feelings, and that has been shown in various consumer and business confidence surveys. What’s odd about this is these readings typically are shown after the stock market has already taken at least a 25%+ drop and the economy is in recession. We’re less than 10% off the highs currently, and no official recession yet. Are concerns overblown and this will setup a rally to new highs, or are the concerns rightly justified and there is much more pain coming? What this means or foretells I won’t pretend to know or predict. To me, the charts and signals will tell the story, and I’ll continue to follow price. As always, reach out with any questions or concerns.
Cory McPherson is a financial planner and advisor, and President and CEO for ProActive Capital Management, Inc. He is a graduate of Kansas State University with a Bachelor of Science in Business Finance. Cory received his Retirement Income Certified Professional (RICP®) designation from The American College of Financial Services in 2017.
DISCLOSURE
ProActive Capital Management, Inc. (PCM”) is registered with the Securities and Exchange Commission. Such registration does not imply a certain level of skill or training.
The information or position herein may change from time to time without notice, and PCM has no obligation to update this material. The information herein has been provided for illustrative and informational purposes only and is not intended to serve as investment advice or as a recommendation for the purchase or sale of any security. The information herein is not specific to any individual's personal circumstances.
PCM does not provide tax or legal advice. To the extent that any material herein concerns tax or legal matters, such information is not intended to be solely relied upon nor used for the purpose of making tax and/or legal decisions without first seeking independent advice from a tax and/or legal professional.
All investments involve risk, including loss of principal invested. Past performance does not guarantee future performance. This commentary is prepared only for clients whose accounts are managed by our tactical management team at PCM. No strategy can guarantee a profit.
All investment strategies involve risk, including the risk of principal loss.
This commentary is designed to enhance our lines of communication and to provide you with timely, interesting, and thought-provoking information. You are invited and encouraged to respond with any questions or concerns you may have about your investments or just to keep us informed if your goals and objectives change.