
In my last newsletter I discussed some of the reasons why a year-end rally could take place in the stock market and the support levels I was watching. With where we stand today, a year-end rally may be starting this week after a further decline occurred in October. The support levels I was watching did not hold last month. Does it mean a year-end rally won’t happen now? Not necessarily, but it could change the outlook going forward in the near term.
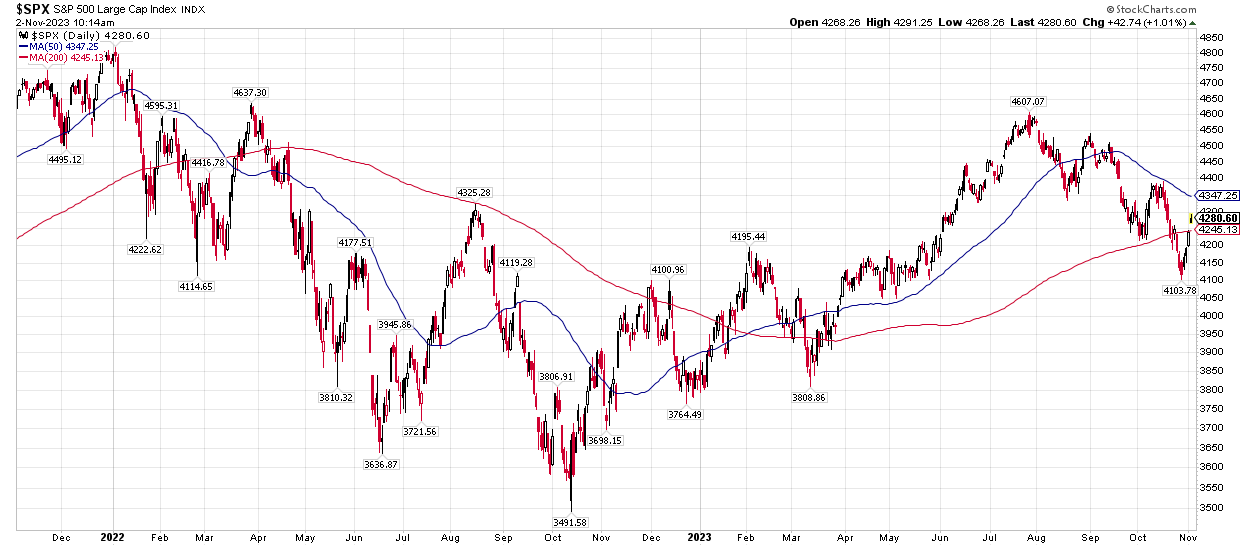
As you can see on the S&P 500 chart above, the 200-day moving average (red line) did not hold, nor the support levels around 4200. The market did bounce from support to start October, but another selloff occurred, and this time made a lower low, breaking support. October ended up being the 3rd month in a row with the market down. The deeper drop than expected doesn’t mean we won’t get some type of rally, but it does raise the odds that a rally could ultimately fail to make a new swing high above the peak around 4600 from July. A lower high would put the S&P 500 into a confirmed downtrend and the bear market that began in early 2022 could be back in earnest.
Sentiment in the market has continued to crater, as levels of fear have grown. As I’ve pointed out previously, this can typically lead to a rally in the market as investors become overly bearish. You may have noticed the growing number of market prognosticators calling for an imminent market crash. This is fairly typical when the market is dropping, but they are rarely right. It can be another gauge of market sentiment and fear in the market.
Many are looking at the Q3 GDP (Gross Domestic Product) report of an annualized 4.9% growth as a great sign for the economy going forward. What you want to remember is that is a backward-looking number, and not necessarily an indication of where things are going from here. Much of the increase in the GDP came from growth in consumer spending on goods and services. Real disposable personal income though contracted during the quarter, putting into question how much spending growth can continue.
The increase in the GDP though did not influence the Federal Reserve into raising interest rates again. Yesterday, November 1st they announced their benchmark interest rate would stay the same as they await more evidence on the easing of inflation and the cooling off of the economy.
It remains clear the economy continues to be resilient despite high inflation and high interest rates. Does that mean a soft landing will occur? I don’t see how anybody knows that for sure. And even if that is the eventual outcome, it doesn’t mean the stock market has to go up. I outlined in the last newsletter some areas of the market that are more economically sensitive as showing weakness. That has continued over the last month. Small Caps, Transportation stocks, and Banking stocks have all continued down.
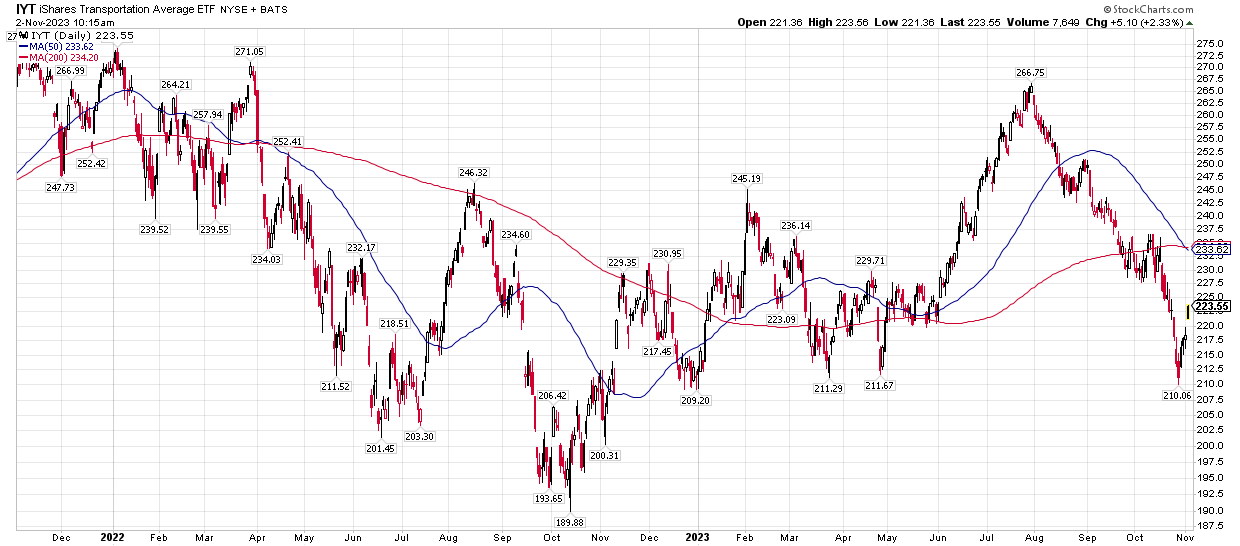
The chart above shows you how transports have continued their drop and have wiped out all gains for the year. Small caps recently dropped below their low from a year ago in October. Those continue to be negative signs for the longer-term outlook on the market.
One investment that has caught the eye of many investors and the financial press is the long-term treasury bond ETF (exchange-traded fund), TLT. This fund invests in U.S. government treasury bonds that are 20 years or longer in duration. With interest rates going up, it brings the value (price) of the bonds down. You can see that in the chart below of TLT.
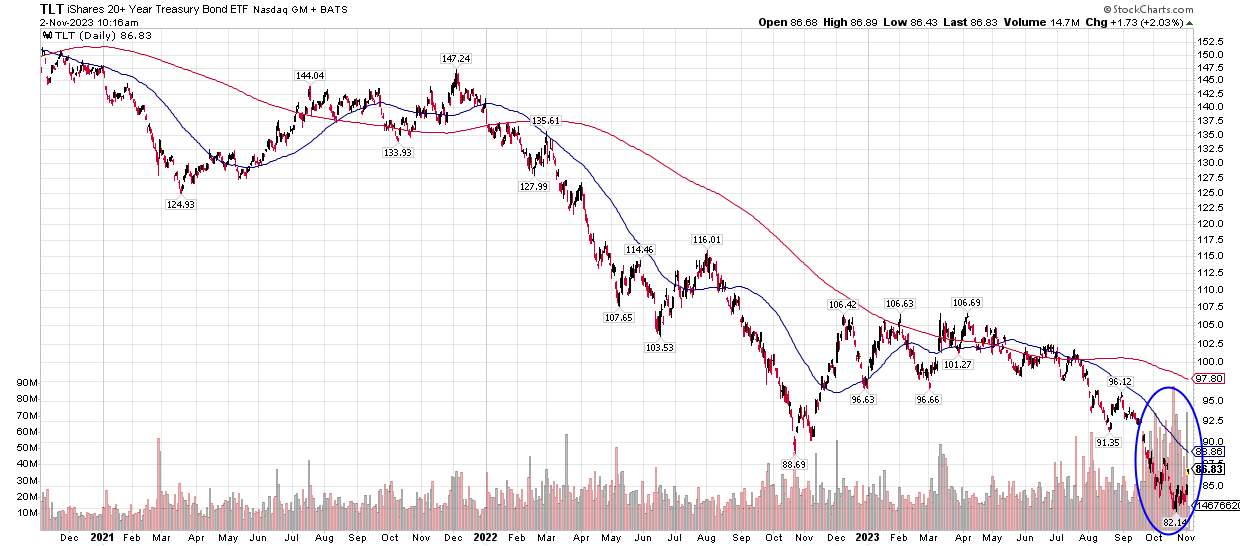
Over the last 3 years it has dropped in price from about $150/share to almost $82/share. Many think of treasury bonds as a sort of “safe haven”. Treasury bond funds like this, especially those with longer duration, can be just as volatile as the stock market. In a rising interest rate environment, you do not want to hold duration and the chart above illustrates that. With the large drop that has continued to occur recently, it has led to many investors trying to catch the bottom in the fund. The bars at the bottom of the chart measure volume, and you can see over the last month the large increase in sustained volume on this fund as shown in the blue circle. The reason why someone would buy this fund is an expectation of a drop in interest rates coming, which would lead to this increasing in value. Is it a sign of investors expecting interest rates to drop? Or are they trying to catch a falling knife in an investment that’s down almost 50% from its highs only to find out it can go lower? We’ll find out over the next few months, and it very well could have an impact on the stock market.
Overall, the technical picture still favors some sort of a rally in stocks before the end of the year. The shape and structure of that rally should lend clues as to whether it will fail to make a new high from July or breakout and be on its way to a new high for the year. If the market rally points more towards a breakdown, then it would provide an exit point for more aggressive positions. That could lead to the bear market continuing and a return to much more defensive positioning needed. While some may have thought the bear market ended in October of 2022, if the S&P can’t get to new highs then the rally to 4600 earlier this year could be thought of as a rally within a long-term bear market. Many areas within the market need to improve for the long-term outlook to become more positive.
Cory McPherson is a financial planner and advisor, and President and CEO for ProActive Capital Management, Inc. He is a graduate of Kansas State University with a Bachelor of Science in Business Finance. Cory received his Retirement Income Certified Professional (RICP®) designation from The American College of Financial Services in 2017.
DISCLOSURE
ProActive Capital Management, Inc. (PCM”) is registered with the Securities and Exchange Commission. Such registration does not imply a certain level of skill or training.
The information or position herein may change from time to time without notice, and PCM has no obligation to update this material. The information herein has been provided for illustrative and informational purposes only and is not intended to serve as investment advice or as a recommendation for the purchase or sale of any security. The information herein is not specific to any individual's personal circumstances.
PCM does not provide tax or legal advice. To the extent that any material herein concerns tax or legal matters, such information is not intended to be solely relied upon nor used for the purpose of making tax and/or legal decisions without first seeking independent advice from a tax and/or legal professional.
All investments involve risk, including loss of principal invested. Past performance does not guarantee future performance. This commentary is prepared only for clients whose accounts are managed by our tactical management team at PCM. No strategy can guarantee a profit.
All investment strategies involve risk, including the risk of principal loss.
This commentary is designed to enhance our lines of communication and to provide you with timely, interesting, and thought-provoking information. You are invited and encouraged to respond with any questions or concerns you may have about your investments or just to keep us informed if your goals and objectives change.